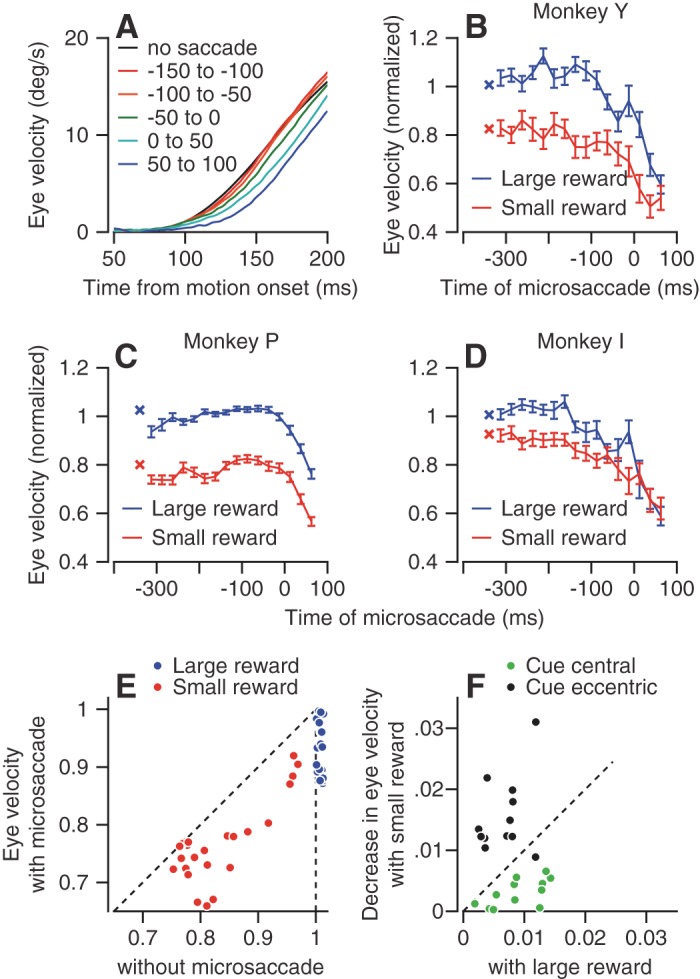
Fig. 8.

Effect of the time and occurrence of microsaccades on the eye velocity at the initiation of pursuit. A: each trace shows average eye velocity of monkey Y as a function of time from the onset of target motion. Data have been averaged across pursuit directions, reward expectations, and cue locations. Different colored traces show the initiation of pursuit when the last microsaccade occurred at different times relation to target motion onset. The black trace shows data from trials that lacked a microsaccade during the fixation period. B–D: the 2 connected sets of symbols in each graph show the normalized eye velocity at the initiation of pursuit as a function of the time of the last microsaccade relative to target motion onset. The target started to move at time 0. Blue and red symbols show data when the monkey had been cued to expect a large vs. small reward. Values were normalized by the average of the eye velocity in the large reward trials for that pursuit direction The × symbols that are not connected to the other traces show the normalized pursuit velocity in trials without microsaccades. Error bars show the SE of the means across directions and cue locations. E: scatter plots of the normalized pursuit eye velocity in trials with vs. without microsaccades in the last 200 ms before target motion. Blue and red symbols show data for trials with large vs. small rewards. Individual symbols show the normalized eye velocity of pursuit for different monkeys, movement directions, and cue locations. Only data from conditions that provided at least 10 microsaccades in the last 200 ms before the onset of target motion were included. F: symbols show the difference in the average normalized eye velocity in trials without vs. with microsaccades. Horizontal and vertical axes correspond to trials with large vs. small reward. Green and black dots correspond to trials with central vs. eccentric color cues.
