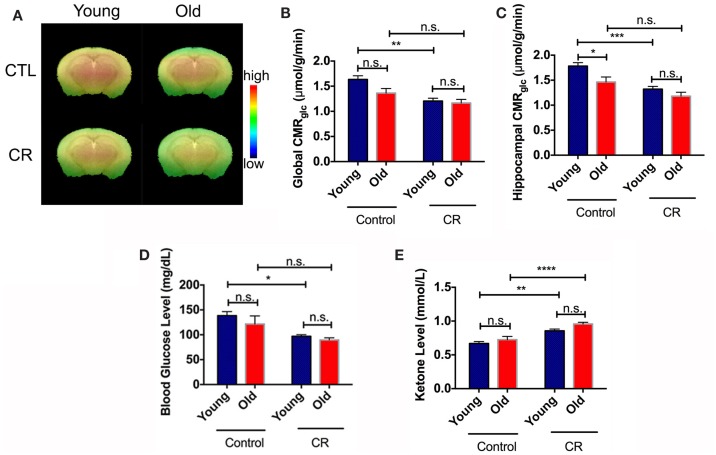
Figure 2.
Caloric restriction induced early onset of glucose reduction and ketone bodies increase. (A) CMRglc visual map of the four mice groups. The color code indicates the CMRglc (in SUV) in a linear scale. (B) Quantitative global CMRglc. (C) Quantitative hippocampal CMRglc. (D) Blood glucose. (E) Blood ketone bodies. Data are presented as Mean ± SEM. *p < 0.05, **p < 0.01, ***p < 0.001, and ****p < 0.0001.

