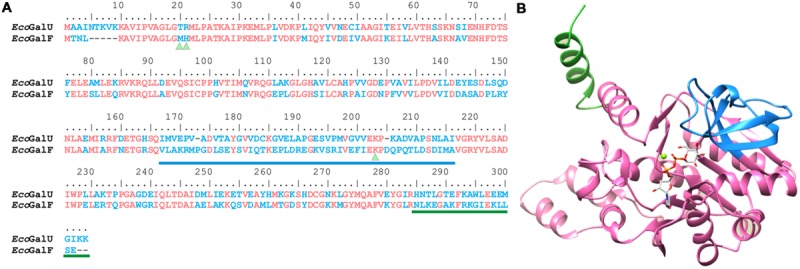
FIGURE 4.

Analysis of Glc-1P binding site. (A) Sequence alignment of GalU and GalF from E. coli. Identical residues are shown in pink and difference in sequence in blue. Triangles indicate the residues analyzed in the present study. The loop involved in Glc-1P binding is underlined in blue and the dimerization fragment in green. (B) Homology model of E. coli GalU. Glc-1P binding site is shown in blue, and the divergent C terminus in green.
