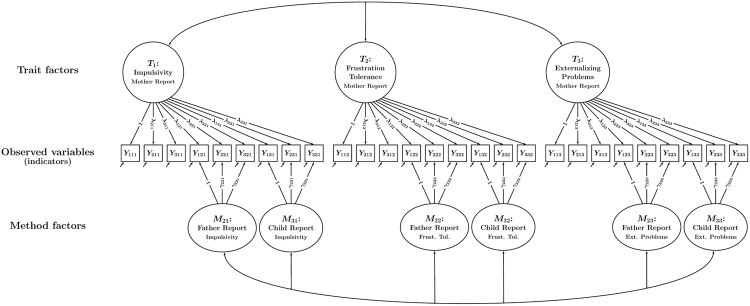
FIGURE 3.
Path diagram illustrating a CT-C(M – 1) model with a single trait factor per trait. In the example, there are three traits and three methods. Each trait-informant combination is measured by three observed variables (indicators) Yimt (i = indicator, m = method or type of informant, t = trait). Trait factors Tt are shown at the top, trait-specific method factors Mmt at the bottom of the figure. The parameters λimt and γimt denote trait and method factor loadings, respectively. All trait factors can be correlated and all method factors can be correlated as indicated by double-headed arrows. Correlations between trait and method factors pertaining to the same trait are not allowed.

