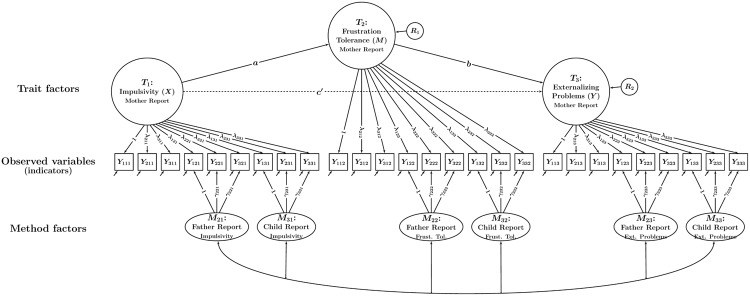
FIGURE 5.
Path diagram illustrating a CT-C(M – 1) mediation model with a single trait factor per trait. In this model, statistical mediation is examined between latent trait factors. The parameters a, b, and c’ denote path (regression) coefficients. R1 and R2: latent residual variables. All other parameters are the same as in Figure 3.

