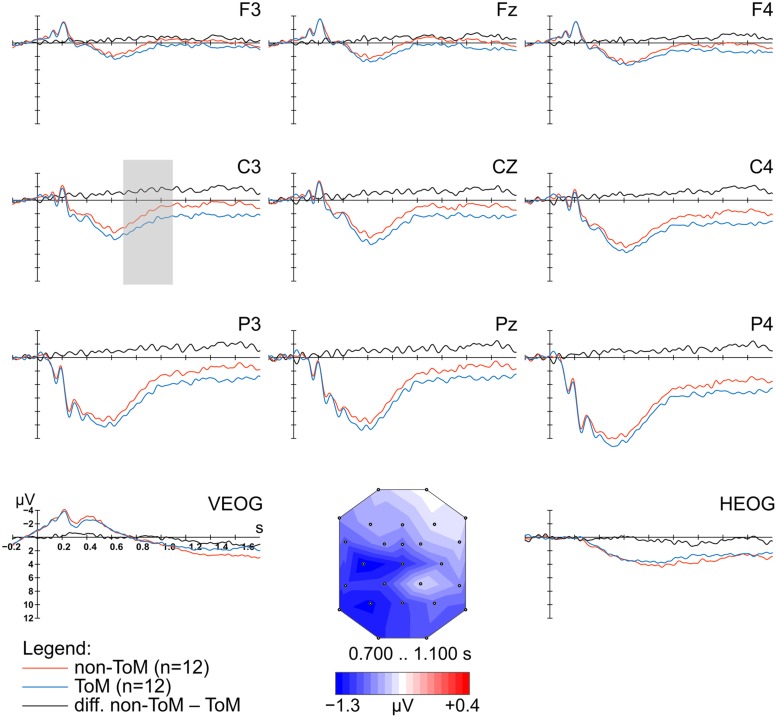
FIGURE 4.
Grand-average ERP waveforms, referenced to the nose, elicited at nine scalp electrodes and two EOG channels in response to the onset of an abstract art image, time-locked to picture onset. Illustrated are waveforms for the two conditions (non-ToM, ToM) and the difference wave (non-ToM-ToM). The time interval used to plot the voltage map is indicated by a gray shade (shown at electrode with highest mean amplitude difference). The voltage map represents the difference between the non-ToM and ToM condition during the time interval 0.700 to 1.100 s after picture onset.

