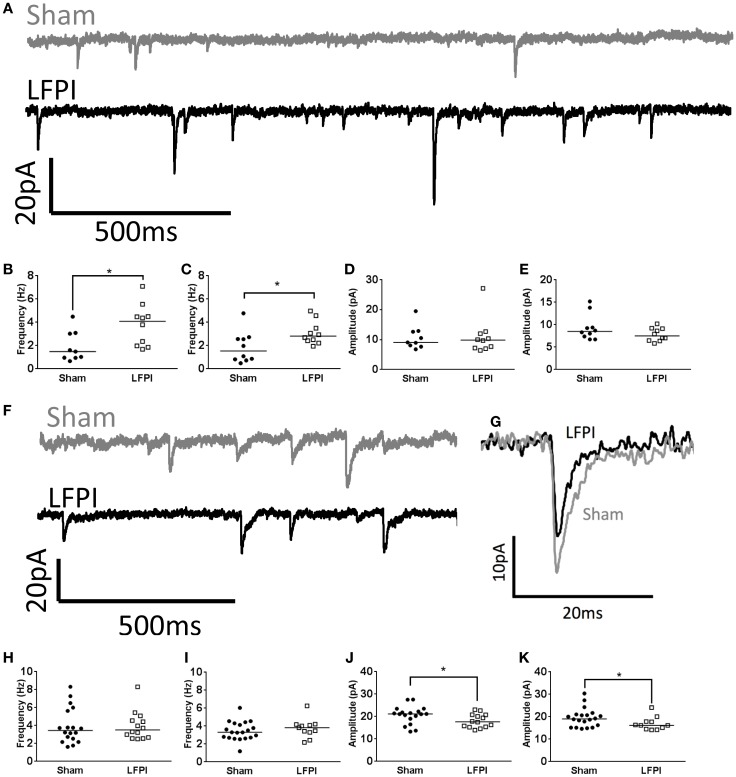
Figure 3.
Shifts in synaptic input onto layer 2/3 following LFPI. (A) Representative traces from layer 2/3 mPFC neurons showing sEPSCs, note the increase in frequency of currents in the LFPI trace. (B) Group data illustrating increase in frequency of sEPSCs and (C) mEPSCs in LFPI neurons (* indicates P < 0.05). (D) Group data illustrating no difference in amplitude of sEPSCs or (E) mEPSCs following LFPI. (F) Representative traces from layer 2/3 mPFC neurons showing sIPSCs. (G) Representative traces of a single sIPSC of median amplitude. Note the decrease in amplitude after LFPI. (H) Group data illustrating no change in frequency of sIPSCs or (I) mIPSCs in LFPI neurons. (J) Group data illustrating increase in amplitude of sIPSCs and (K) mIPSCs following LFPI (* indicates P < 0.05).

