Figure 4.
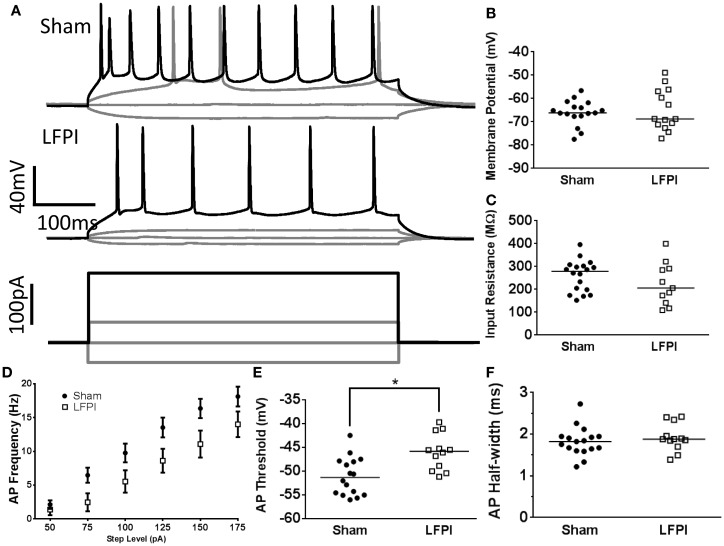
Alterations in layer 2/3 intrinsic excitability following LFPI. (A) Representative traces from layer 2/3 neurons showing voltage response to selected current steps (−50, 0, 50, 175 pA). Response to 175 pA current step shown in black for visual clarity. Note the decreased firing rate in the LFPI trace. (B) Group data displaying no change in resting membrane potential after LFPI. (C) Group data illustrating no difference in input resistance after LFPI. (D) Frequency versus current group data showing an increase in firing rate following LFPI. (E) Action potential threshold is significantly depolarized in slices derived from LFPI animals (* indicates P < 0.05). (F) Action potential half-width is unchanged following LFPI.

