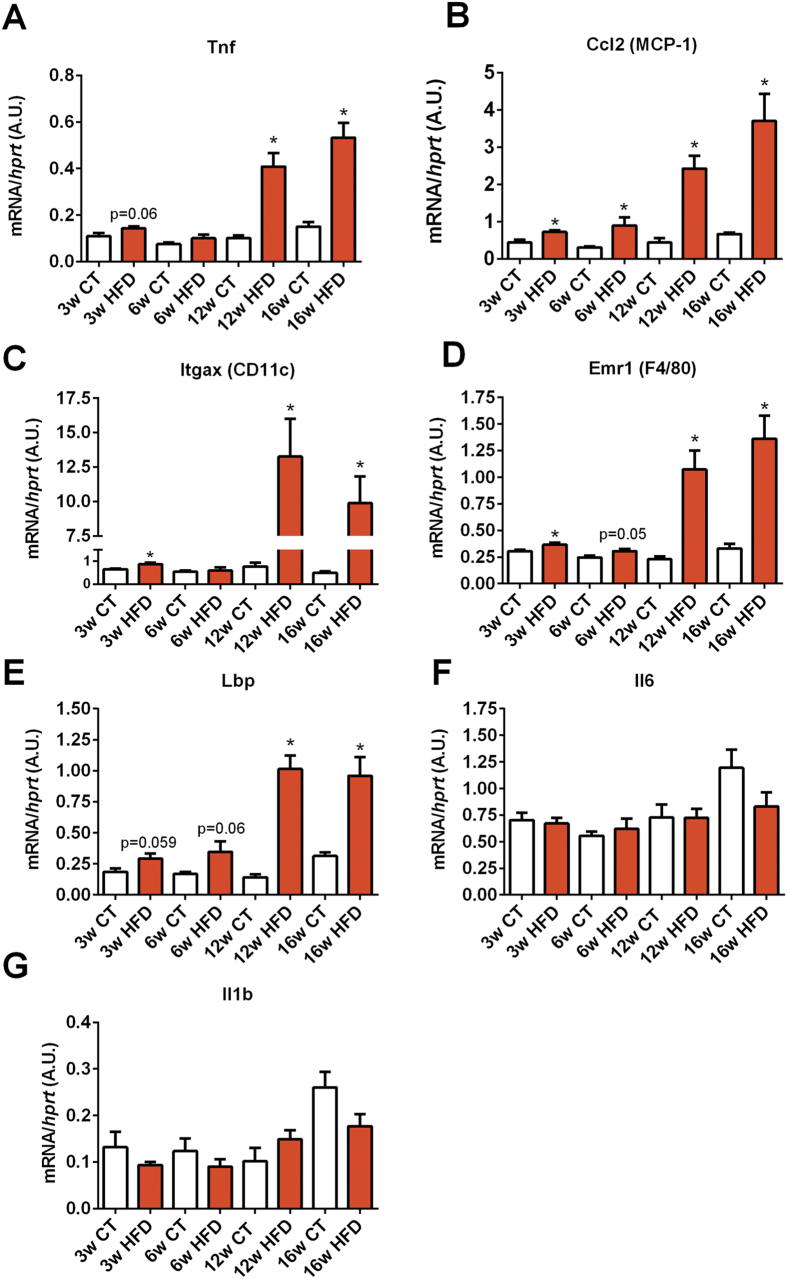
Figure 2. Time series evolution of markers of inflammation and macrophage infiltration in white adipose tissue following HFD administration.
mRNA expression of (A) Tnf (encoding TNF-α), (B) Ccl2 (encoding MCP-1), (C) Itgax encoding CD11c), (D) Emr1 (encoding F4/80), (E) Lbp (encoding LBP), (F) Il6 (encoding Il-6) and (G) Il1b (encoding IL-1β) measured in the adipose tissue after 3 weeks (3w); 6 weeks (6w); 12 weeks (12w) and 16 weeks (16w) of a high-fat diet (HFD) or a control diet (CT) (n = 6/group). Data are presented as the mean ± SEM. Data are significantly different (P < 0.05) according to the unpaired two-tailed Student t-test. *indicates a significant difference versus CT (P < 0.05).

