
Figure 8. Hierarchical clustering.
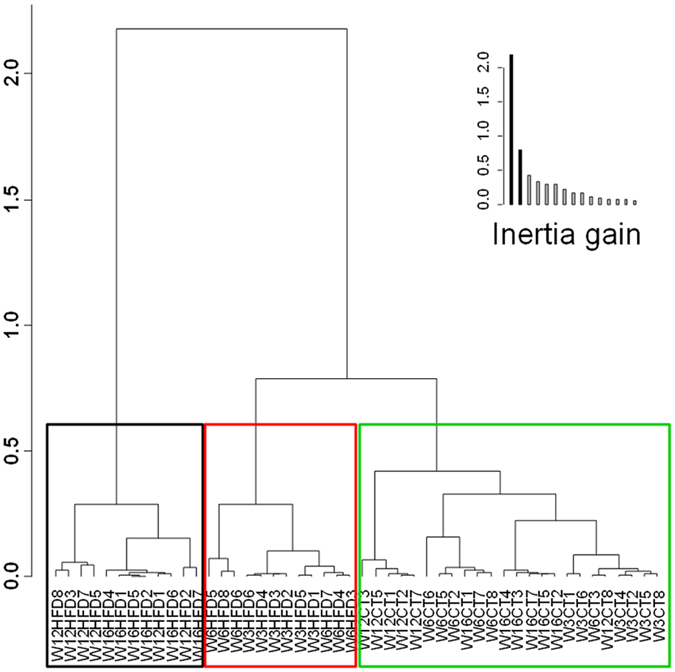
Hierarchical clustering of the samples on the principal components of the multifactorial analysis. This graph illustrates the similarities and the clustering between different samples. The smaller the distance linking samples is (resulting from the addition of horizontal distances in dark line), the more similar these samples are for the parameters measured.