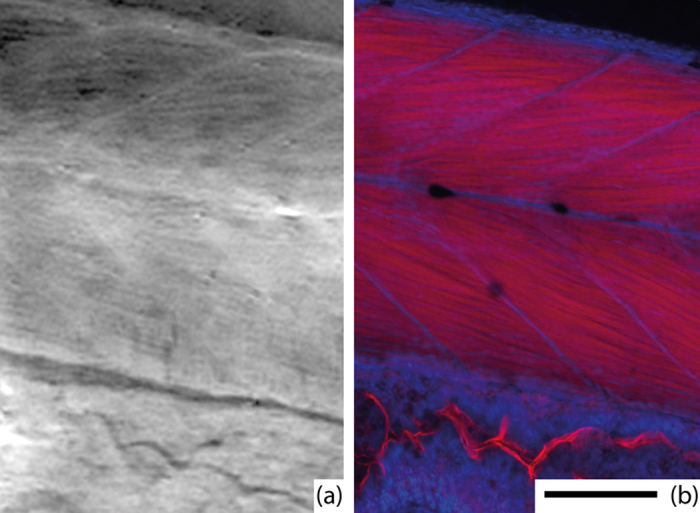
Figure 3. Comparison with histology.

(a) A slice from X-ray phase-contrast tomography and (b) epifluorescent confocal microscopy. The images show the approximately same part of the fish. Muscle myofibrils and myosepta are clearly visible in both images. In the X-ray image, brighter corresponds to stronger phase shift, which is approximately proportional to density, whereas the confocal microscopy shows the red-stained myofibrils and blue-stained nuclei. The scale bar is 100 μm and applies to both images.
