
Figure 1. fdNIRS measurement of brain oxygenation shows hypoxia in patients with MS. StO2 from individual patients from different MS patient sub-types showing the distribution of hypoxia.
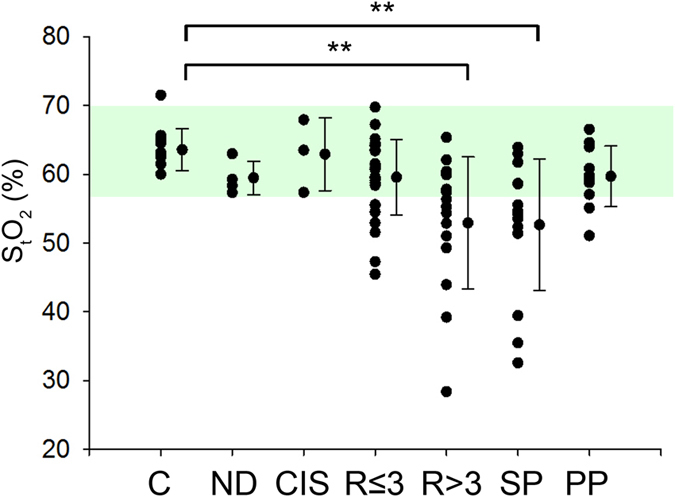
Each dot represents one subject. Beside the subject data are the combined mean ± SD. Green shaded area represents 2 × SD around the control mean. All points below the shading are 2 × SD below the controls (significantly hypoxic). C - control; ND - no disease (patients who were referred to the MS clinic but did not have MS/CIS); CIS - clinically isolated syndrome; R ≤ 3 - RRMS patients with EDSS less than or equal to three; R > 3 - RRMS patients with EDSS greater than three; SP - secondary progressive; PP - primary progressive **p < 0.01.