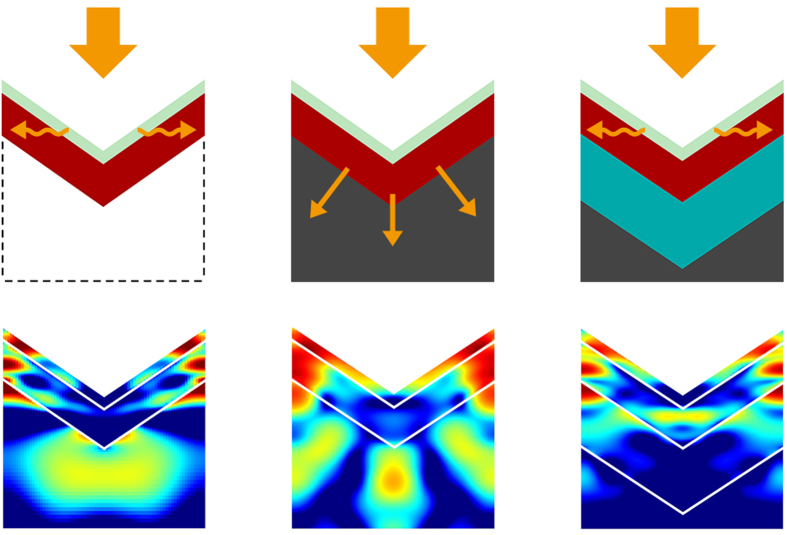
Figure 3. Sketch (top) and light distribution profiles of λ = 650 nm (bottom) for three scenarios: freestanding perovskite top cell in air (left), perovskite/c-Si TSC without IL (middle), and perovskite/c-Si TSC with 500-nm-thick ITO IL (right).
Orange arrows indicate the propagation path of light. The color scales at the bottom are normalized separately for each case.

