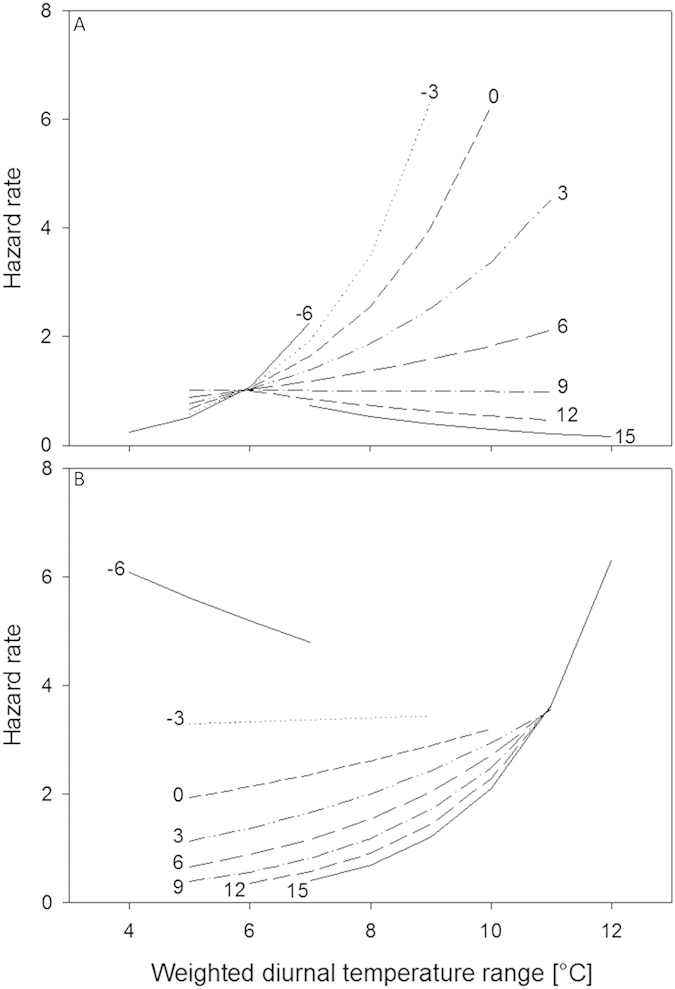
Figure 4.

Hazard rate in relation to minimum temperature and diurnal temperature range (DTR) in easy (A) and semi-natural (B) foraging environment for the best fitting model of Table 1. Fitted lines represent hazard rates for different weighted minimum temperatures (temperatures plotted at line ends) calculated for individuals with a study age at start of 1 year old (population mean) and 0.36 years in study (at which 90% of the population is alive). Lines cover 95% of the data range. See Supplementary Fig. S4 for a contour plot with data distribution and hazard rates.
