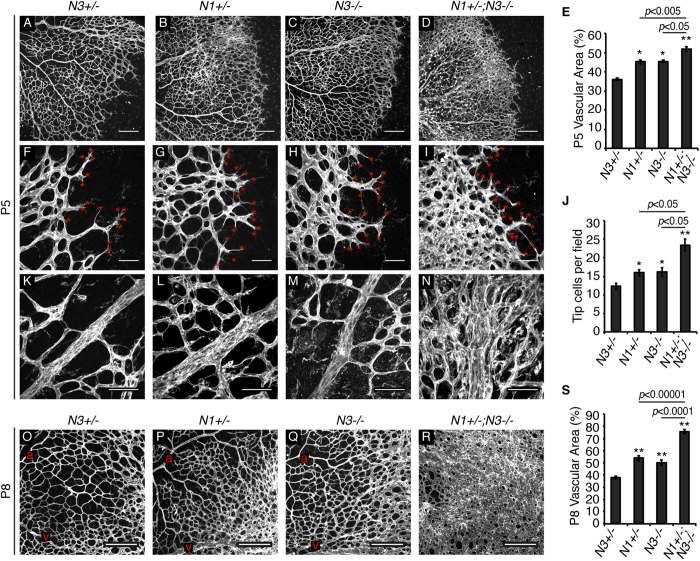
Figure 1. Notch1 and Notch3 limit vessel density during retinal angiogenesis.
Retinas wholemount stained for isolectin B4 to visualize the vasculature. (A–D) Images of the retinal vascular plexus at P5. (E) Quantification of vessel density at P5. (F–I) Images of P5 retinas show tip cells (red asterisks) at the angiogenic front. (J) Quantification of average tip cell number per image field. (K–N) High magnification images of P5 venules immediately distal from the optic nerve. (O–R) P8 retinal vascular plexus (a = arteriole, v = venule). (S) Quantification of vessel density at P8. N1 = Notch1, N3 = Notch3. n≥3 mice per genotype, 2 retinas per mouse. Data are mean±s.e.m. *p < 0.01, **p < 0.001. Scale bars: (A–D,O–R) 200 μm, (F-I,K-N) 50 μm.

