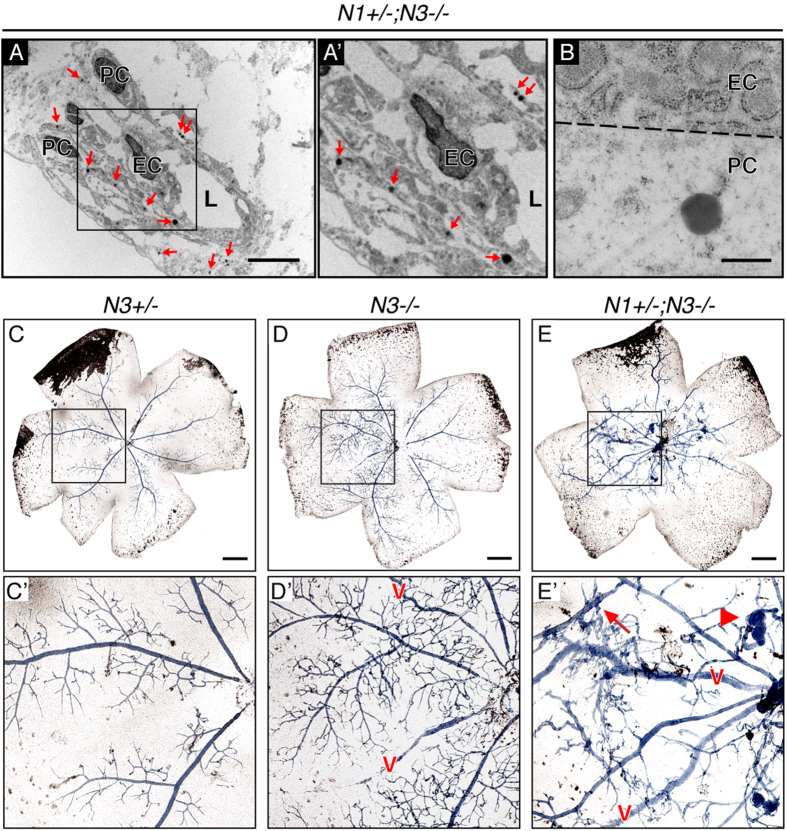
Figure 5. Assessment of vascular pathology in Notch1+/−; Notch3−/− retinas.
(A) GOM deposits (red arrows) associated with the mural cell compartment in electron micrographs of P5 Notch1+/−; Notch3−/− retinal vessels modeling CADASIL. (A’) Area enclosed by black box in A. (B) 50,000× magnification of a GOM associated with a pericyte, endothelial plasma membrane represented by dashed line. Vessel lumen (L), endothelial cell nuclei (EC), and pericyte nuclei (PC). (C–E) Bright field images of whole-mount P13 retinas following blue liquid latex perfusion to assess for AVMs. (C’–E’) Zoomed image of area enclosed by black square in upper panel. Blue latex perfused venules marked with a red v. Notch1+/−; Notch3−/− mice (E’) display vascular tangles (arrowhead) and arteriovenous shunts (arrow). Scale bars: (A) 1 μm, (B) 0.5 μm, (C–E) 500 μm.

