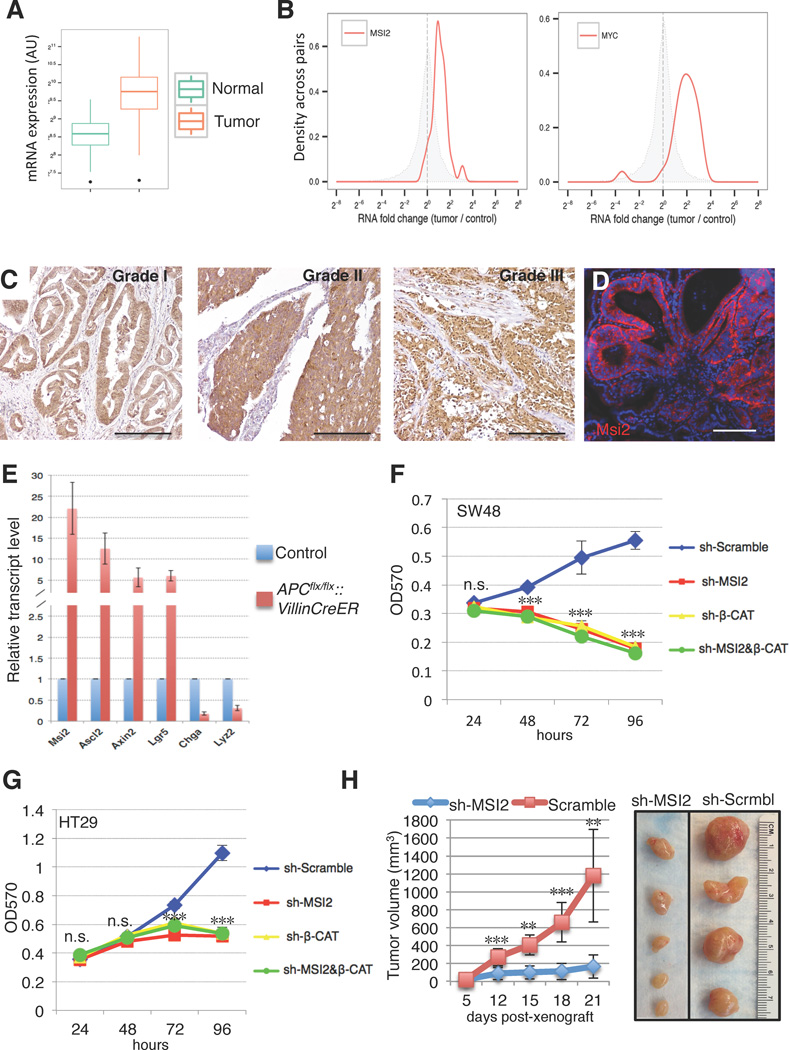
Figure 1. MSI2 contributes to human colorectal cancer cell growth.
(A) MSI2 mRNA expression levels from RNA-Seq on TCGA (the cancer genome atlas) COAD (colorectal adenocarcinoma) tumor samples (314 solid tissue samples from healthy individuals, 314 tumor samples). Expression values were obtained by TMM normalization of read counts in genes. (B) Fold changes for MSI2 (left) and MYC (right) in matched tumor/control RNA-Seq sample pairs from TCGA COAD (total of 26 patients). The distribution of MSI2/MYC fold changes in tumor/control pairs for 26 individuals is plotted in red (intra-individual comparison). The distribution of MSI2/MYC fold changes between control/control comparisons for 26 pairs of healthy individuals is plotted in grey (inter-individual comparison). (C) MSI2 immunochemistry of graded human colorectal adenocarcinomas (scale bar=200µM). (D) Msi2 immunofluorescence showing broad expression in adenomas arising in APCmin/+ mice (scale bar=200µM). (E) Expression analysis for Msi2, Wnt target genes (Ascl2, Axin2, Lgr5) and differentiation-related genes (Chga, Lyz) in the intestinal epithelium after acute ablation of APC in APCflox/flox::Villin-CreER mice (error bars denotes s.d., n=3). (F, G) MTT proliferation assays of human colorectal cancer cell lines SW48 (F) and HT29 (G) infected with lentiviral knockdown vectors for MSI2, β-CATENIN, or scramble controls. Error bars indicated s.e.m. from six independent experiments per cell line per condition. ***: p<0.0005, Student’s t-test. (H) Tumor growth curves of HT29 colon cancer cell xenografts infected with lentivirus expressing scramble control hairpin or sh-MSI2. Error bars denote the s.d. derived from 4 tumors in each of 2 mice per group. Representative images of xenograft tumors are shown on the right. **: p<0.005, ***: p<0.0005, Student’s t-test.

