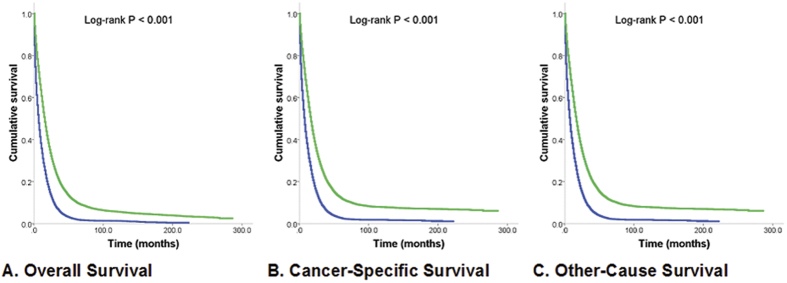
Figure 2. Kaplan-Meier Estimates of All-Cause, Cancer–Specific, and Other-Cause Mortality for Patients Who Had Undergone Primary Tumor Resection and Patients Who Had Not.
Median survival times were compared using the log-rank test. (A) Overall survival. Green line, PTR patients; 24 570 deaths/27 931 patients; 16 months. Blue line, non-PTR patients; 15 494 deaths/16 583 patients; 7 months. (B) Cancer-specific survival. Green line, PTR patients; 22 728 deaths/27 931 patients; 17 months. Blue line, non-PTR patients; 14 572 deaths/16 583 patients; 8 months. (C) Other-cause survival. Green line, PTR patients; 1 842 deaths/27 931 patients; 229 months. Blue line, non-PTR patients; 922 deaths/16 583 patients; 161 months.

