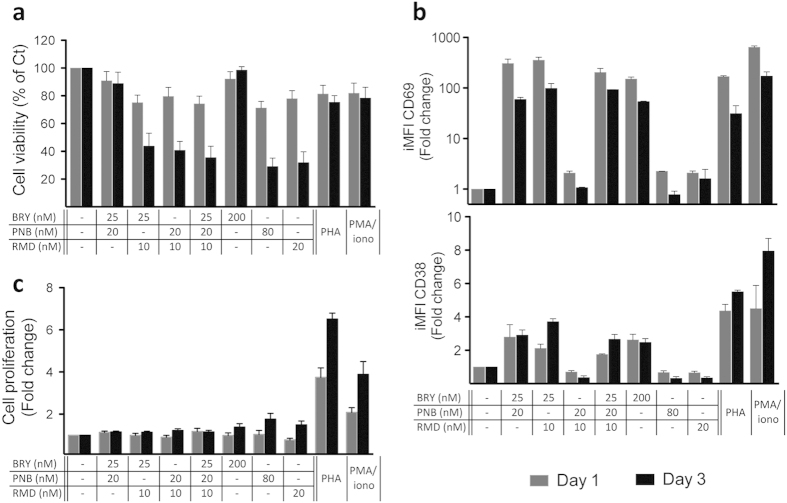
Figure 3. Primary human cells phenotype after treatment with selected drug combinations.
Purified CD4 T cells from healthy subjects were treated with the indicated concentrations of BRY, PNB, RMD or with PHA or PMA/ionomycin for 1 (grey bars) and 3 (black bars) days. (a) Cell viability was determined using 7AAD reagent and analysed by flow cytometry and expressed as percentage. (b) The surface expression of the activation markers CD38 and CD69 in viable CD4 T cells were analysed by flow cytometry and expressed as iMFI. (c) Cell proliferation was determined as BrdU incorporation measured by ELISA. Results are normalized to control vehicle-treated CD4 T cells from the same donors and represent the mean + SEM of three independent experiments.

