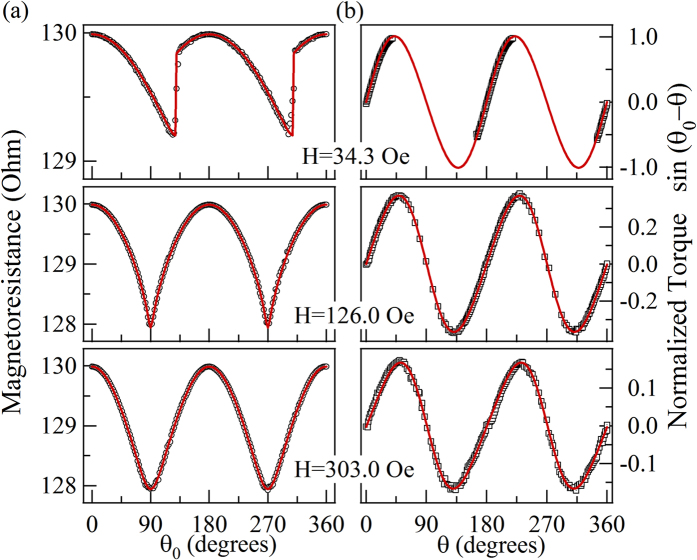
Figure 3. The RAMR curves and normalized torque curves obtained in different magnetic fields.
(a) Symbols represent experimental  curves measured at
  = 34.3 Oe, 126.0 Oe, and 303.0 Oe respectively; red lines are calculated curves used for corresponding fitted anisotropy constants. (b) The data of normalized torque curves
  as a function of
  ; symbols are experimental data and the solid curves are fitting curves based on Eq. (8).

