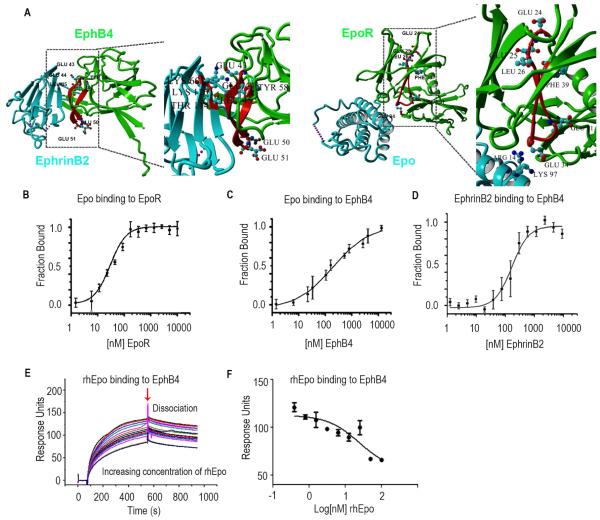
Figure 1. Epo Binds to EphB4.
(A) X-ray crystal structure of EphB4 (green), EphrinB2 (blue) and Epo (blue) -EpoR (green) complex. The C-D region from which the inhibitory peptide has been derived from is highlighted in red. E43, E44 and L45 are involved in EphrinB2 binding. Interactions between homology region with EpoR and ligand are shown in detail: E43, E44 and L45 of EphB4 interact with K60, T114 and K116 of EphrinB2. The acidic residues in the apical position of the loop (E50, E51) are shown as well. The A-B loop region homologous to the inhibitory peptide is highlighted in red. Interaction between K97 and R14 of Epo with acidic residue located on the apical loop of the homology region (E34). The region homologous to EphB4 ranges from E24, E25, L26 to F39. E24, E25 and L26 of EpoR are homologous to residues E43, E44 and L45 of EphB4 which are involved in Ephrin ligand binding. Acidic residues are located in the loop in an apical position similar to the location of acidic residues in the A-B loop region of Epo Receptor. (B) Fluorescence microscale thermophoresis analysis of Epo binding to EpoR or (C) EphB4. (D) EphrinB2 binding to labeled EphB4. (E) Surface competition assay (SCA) of Epo and EphrinB2 with coated EphB4 receptor using the BIAcore instrument for detection of bound protein. Serial dilutions of Epo were mixed with EphrinB2 and injected onto a CM5 chip to which EphB4 was bound. (F) Bound protein shown as response units (RU) at the end of association was plotted as a function of Epo concentration and fit with a three-parameter non-linear regression using Graphpad Prism 5.0. Samples and a buffer blank were injected in duplicate. Mean ± SEM values are shown. (n=3). (See also Figure S1).

