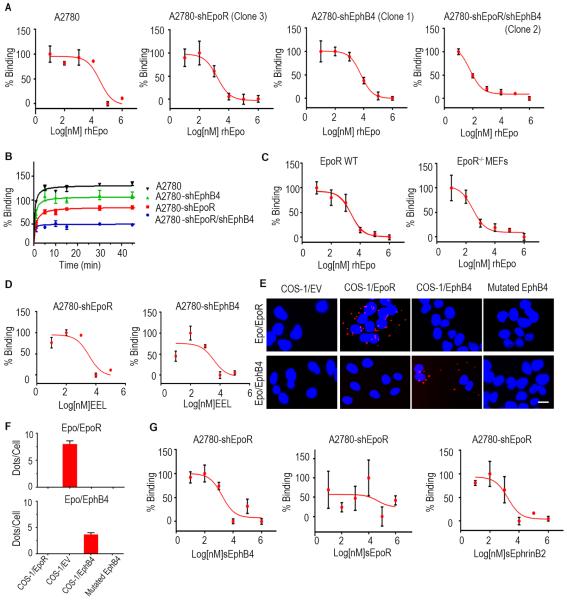
Figure 2. Characterization of rhEpo binding to EphB4 cells.
(A) Analysis of competitive binding of [I125]rhEpo to A2780-parental, -shEpoR, -shEphB4, and shEpoR/shEphB4 cells. (B) Kinetics of [I125]rhEpo binding to A2780-parental, -shEpoR, -shEphB4, and -shEpoR/shEphB4 cells. (C) Analysis of competitive binding of [I125]rhEpo to EpoR WT and EpoR−/− MEFs. (D) Competitive binding studies using the EEL peptide in A2780-shEpoR or -shEphB4 cells. (E) Proximity ligation assay using Cos-1EpoR, Cos-1EphB4, and mutated EphB4 cells. Scale bar represents 50 μm. (F) Bar graph represents the quantification of ligation assay. (G) Competitive binding studies using soluble EphB4, EpoR or EphrinB2 in A2780-shEpoR cells. CPM, counts per minute. Mean ± SEM values are shown. (n=3). (See also Figure S2 and Table S1-S2).

