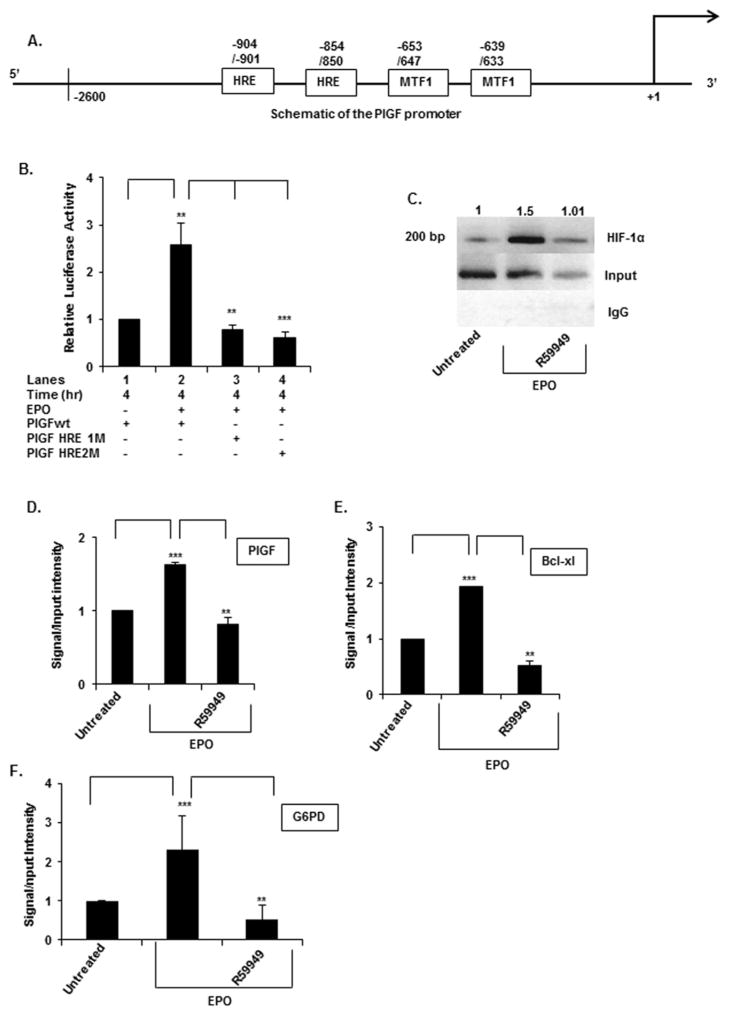
Figure 2. PlGF promoter activity requires the activity of HIF-1α-binding sites (HREs).
(A) Schematic diagram of the PlGF promoter (nt positions − 2622/+ 10, relative to transcription start site) showing two HRE and two MTF-1-binding sites. (B) K562 cells were transfected with the wt PlGF promoter-luc, PlGF promoter with mutations in the HRE site at positions − 854/− 850 (HRE1M) and at positions − 904/− 901 (HRE2M). K562 cells were co-transfected with Renilla luciferase plasmid for 24 h. Cells were treated with EPO for 4 h. Luciferase activity was normalized to Renilla luciferase activity to correct for transfection efficiency and the data are expressed as relative expression compared with either the luciferase activity of untreated cells or the wt construct, as indicated in the figure. Data are means ± S.D. of three independent experiments. (C) ChIP analysis of K562 cells treated without and with EPO for 2 h, for assay of HIF-1α binding to the PlGF promoter. HIF-1α antibody (top row) or control rabbit IgG (bottom row) were used for immuno-precipitation of soluble chromatin. The middle panel represents the amplification of input DNA before immunoprecipitation. (D–F) Quantitative analysis of PlGF (D) (ChIP, panel C), the Bcl-XL (E) and the G6PD (F) promoters by qPCR of CHIP utilizing HIF-1α antibody. Primers used to amplify the PCR products in the PlGF, Bcl-XL and the G6PD promoter are indicated in Table 1. Data are representative of three independent experiments. ***P < 0.01, **P < 0.01, *P < 0.05, ns, P > 0.05.

