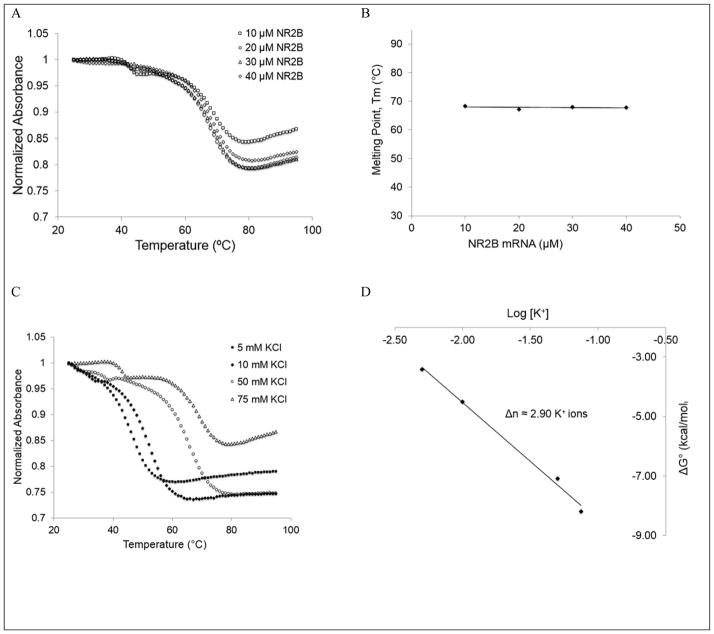
Figure 3.
UV spectroscopy thermal denaturation data of NR2B mRNA. (A) NR2B mRNA at 75 mM KCl as a function of RNA concentration, indicating an intramolecular structure formation. (B) G-quadruplex melting temperature at 75 mM KCl as a function of the RNA concentration. (C) 10 μM NR2B mRNA as a function of KCl concentration, showing an increase in Tm due to K+ driven stability. (D) Plot of NR2B mRNA ΔG° as a function of logarithm of K+ ion concentration, where Δn represents the number of K+ ions released upon G quadruplex unfolding.

