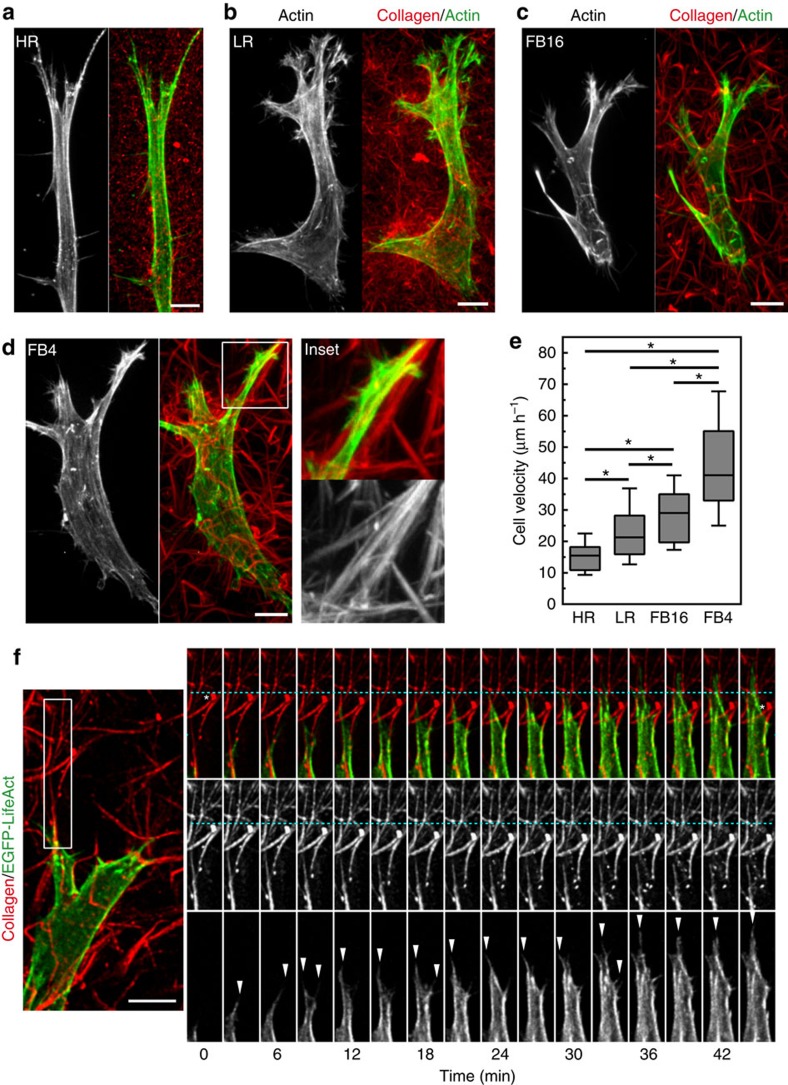
Figure 2. Migratory differences and similarities as fibroblast traverse different ECM architectures.
(a–d) MIP images of HFFs for actin (green) within Atto-647N labelled collagen gels (red) demonstrates cell morphology differences associated with HR, LR, FB16 and FB4 ECMs. Inset (white box in d) illustrates pseudopodial extension along bundled collagen fibrils in FB4 ECM. Note the changes in cell morphology with changes in the ECMs. (e) Fibroblast migration velocity for each ECM. N>3 replicates, n>60. Errors bars: s.e.m. (f) Live-cell microscopy of a fibroblast expressing EGFP-Lifeact (green or grayscale) within FB4 ECM (red). Timelapse montage (right panels) illustrates the formation of actin-rich filopodial structures (arrowheads) forming along bundled collagen fibrils, directing migration. White asterisks indicate the initial and final positions of collagen fibrils relative to a fiduciary line (cyan) after cellular contraction pulls the matrix towards the cell body, while the leading edge protrudes forward. *P<0.05 (ANOVA), N≥3, n≥70 for all conditions. Scale bars, 10 μm.

