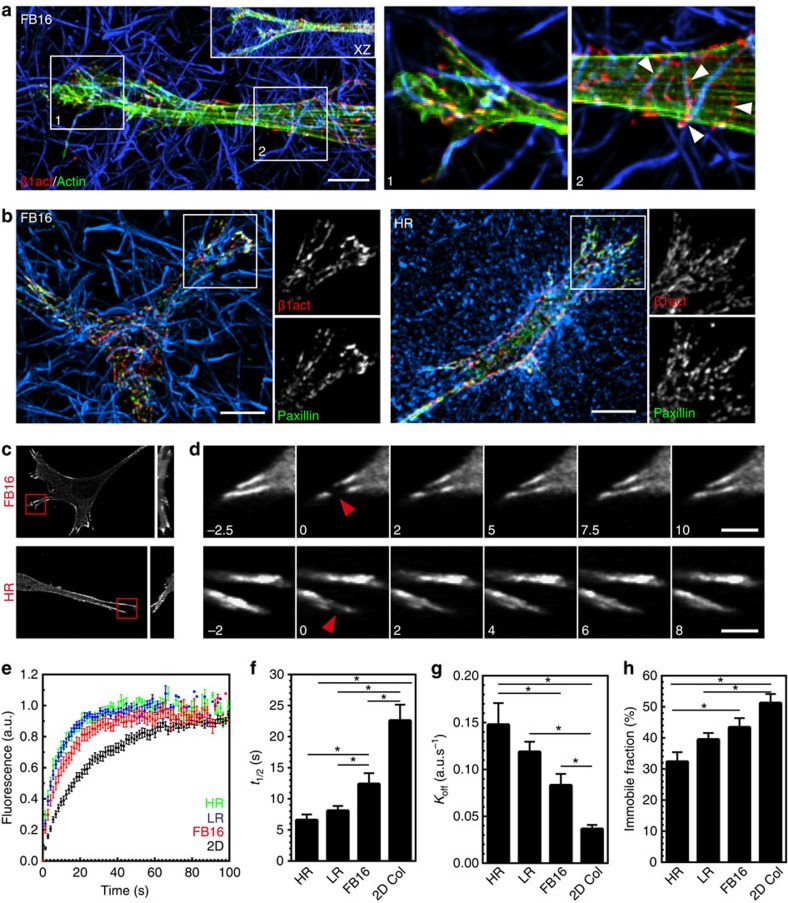
Figure 3. ECM fibre stiffness alters adhesion turnover but not adhesion components.
(a) Full MIP localizing activated β1 integrin (9EG7: red) and phalloidin staining for F-actin (green) in FB16 ECMs. Inset shows XZ projection. Panels 1 and 2 illustrate integrins following the contours of the ECM and not stress fibre arrangement (indicated by arrowheads). Panels 1 and 2 are partial Z projections of the cell region. (b) Localization of activated β1 integrin (9EG7: red) and paxillin (green) in FB16 (left) and HR collagen matrices (right). Insets show variable colocalization that is prominent at the leading edge. All images are maximum intensity Z projections of ∼30 μm. (c) MIP images showing eGFP–zyxin localization in HR or FB16 ECM acquired before FRAP. 3D YZ MIP shown on the right. (d) Timelapse sequence shown in c illustrating EGFP-zyxin FRAP kinetics. Red arrowheads indicate the FRAP site. Time is in seconds. (e–h) FRAP kinetic analysis showing t1/2 (f) Koff rates (g) and immobile fractions related to the graphs in E. N≥3, and n≥20 for all conditions. Errors bars: s.e.m. *P<0.05 (ANOVA). Scale bars: (a,b) 10 μm, (d) 5 μm.

