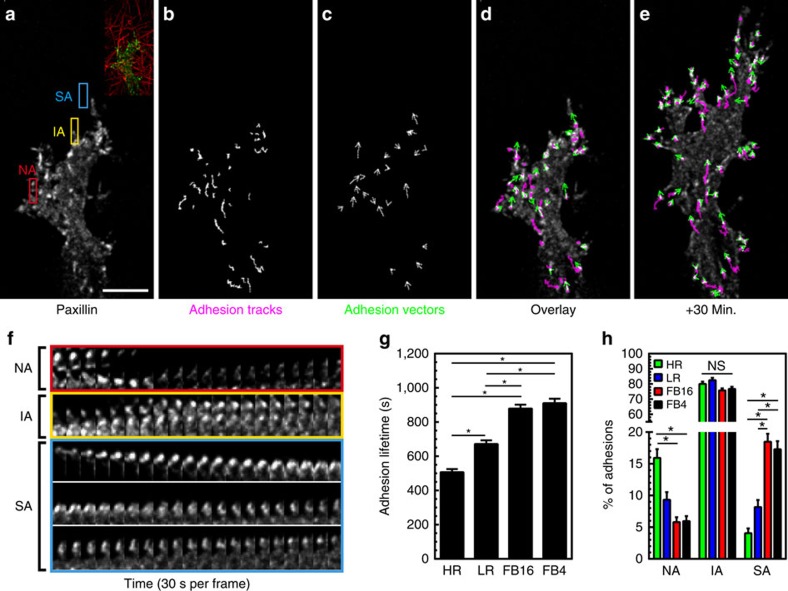
Figure 4. 3D adhesion maturation depends on ECM stiffness.
(a) MIP of EYFP-paxillin adhesions associating with FB4 collagen gels. Inset shows ECM structure. (b,c) Adhesion-tracking mapping of adhesion displacements over their lifetime, while adhesion vector mapping (c) illustrates their averaged instantaneous movement. (d,e) Overlay of EYFP-paxillin (white) adhesion tracks (magenta) and adhesion vectors (green) at the time point shown in a (d) and 30 min later (e). (f) Timelapse kymographs from the colour-coded boxes in a illustrating adhesions with different lifetimes. Red box: nascent adhesions (NA: 0–120 s.). Yellow box: intermediate adhesions (IA: 500–1,500 s.). Cyan box: stable adhesions (SA: >1,500 s.). Adhesion for cyan appears several frames after the initial timepoint. (g) Average lifetime of adhesions for each condition. (h) Percent of adhesions considered NA, IA, or SA in each ECM condition. n-values for (g,h) are >500 adhesions and a minimum of 6 cells per condition. Errors bars: s.e.m. *P<0.05 (ANOVA). Scale bar, 10 μm.

