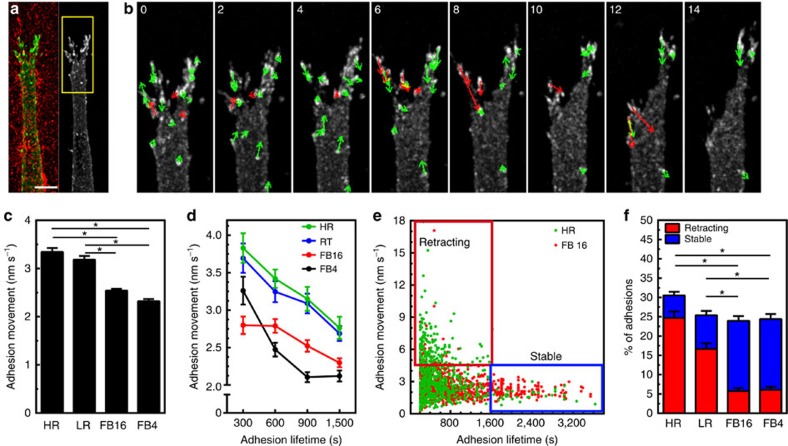
Figure 5. Identification of two distinct 3D adhesion populations dependent on ECM/rigidity.
(a,b) Rapid movements of EYFP-paxillin adhesions in HR collagen. (b) Timelapse montage of region depicted in a. Arrows indicate direction of adhesion movement: Red arrows highlight adhesions undergoing rapid movement that retract away from the leading edge and slow migration. Time is in min. (c) Average movement of adhesions within the different ECMs. (d,e) Adhesion movement plotted against grouped adhesion lifetime (d) or as a scatterplot (e). Boxes in e show retracting (red) and stable (blue) adhesion populations. (f) Percent of adhesions that are retracting (red) or stable (blue) in each ECM. n-values for (c) through (f) are >500 adhesions and a minimum of six cells per condition. Errors bars: s.e.m. *P<0.05 (ANOVA). Scale bar, 10 μm.

