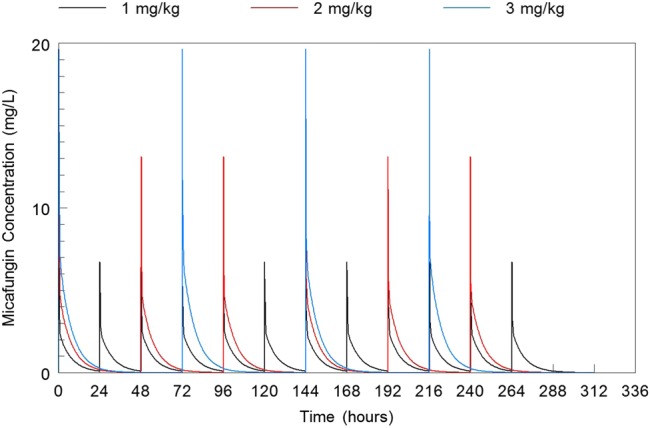
Figure 5.

The mean AUC 0–312h values over the 13 days of dosing were similar for the 3 micafungin dosage groups of 1 mg/kg every 24 hours, 2 mg/kg every 48 hours, and 3 mg/kg every 72 hours administered intravenously. Abbreviation: AUC0–312h, the area under the plasma drug concentration - time curve.
