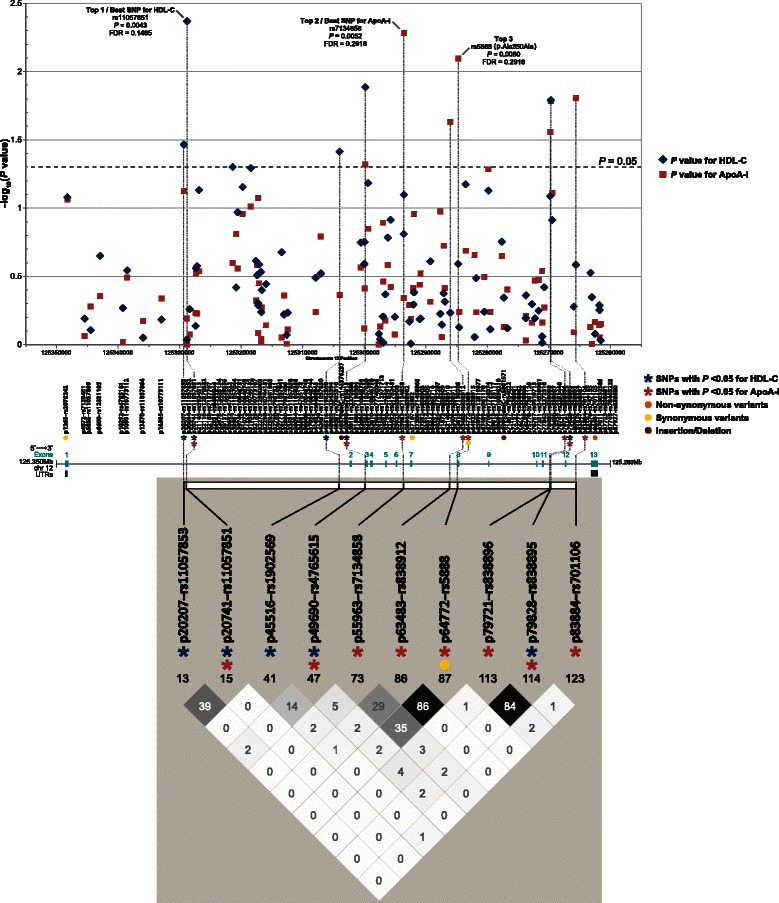
Fig. 2.

Single-site P-values of 94 SCARB1 common variants for HDL-C and ApoA-I. Top: The -log10 P-values are presented in the Y-axis. A total of 94 genotyped variants with MAF ≥5 % are shown on SCARB1 gene (5′ → 3′; RefSeq: hg19, NM_005505) in the X-axis. The dash line indicates the nominal significance threshold (P = 0.05). Middle: Gene structure of SCARB1. Bottom: Linkage disequilibrium (LD) plot of 10 SCARB1 variants with P-values <0.05. Shades and values (r2 × 100) in each square of LD plot indicate pairwise correlations: black indicating r2 = 1, white indicating r2 = 0, and shade intensity indicating r2 between 0 and 1. Marker names are shown as “SNP name-SNP ID”. SNP ID is based on dbSNP build 139. ApoA-I, apolipoprotein A-I; FDR, false discovery rate; HDL-C, high-density lipoprotein cholesterol; LD, linkage disequilibrium; MAF, minor allele frequency; SNP, single nucleotide polymorphism; UTR, untranslated region
