
Fig. 3.
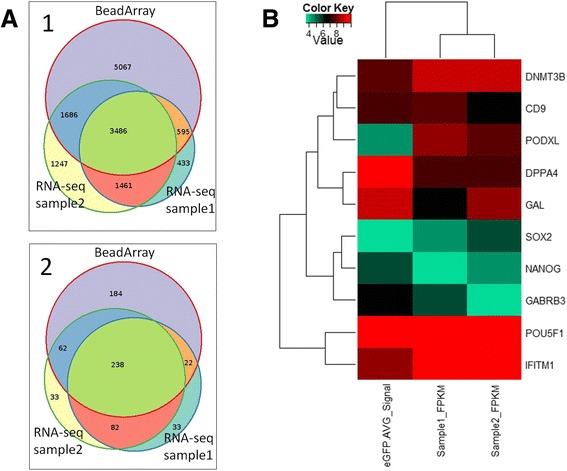
Overlap between microarray and sequencing measurements. a.1 Venn diagram displaying overlap of significant genes found in the Illumina microarray and next-generation sequencing (NGS) experiments. Genes expressed with Illumina detection p-value < 0.05 in the microarray experiment or FPKM > 0.5 in the NGS experiments were considered significant. Genes were compared via HGNC gene symbol annotation. a.2 Venn diagram displaying overlap of significant CPDB categories found in the Illumina microarray and deep sequencing experiments. Significant genes from microarray and NGS experiments were analysed with the CPDB functional annotation tool and categories with a q-value <0.05 were considered significant. b Pluripotency associated genes from microarray experiment and NGS experiments of sample1 and sample2 were compared. Logarithmic values (base 2) of Illumina average signals and FPKM values from expressed genes (detection p-value < 0.05, FPKM > 0.5) were quantile normalized and subjected to cluster analysis via R heatmap2 function using Euclidean distance as distance measure