
Figure 2.
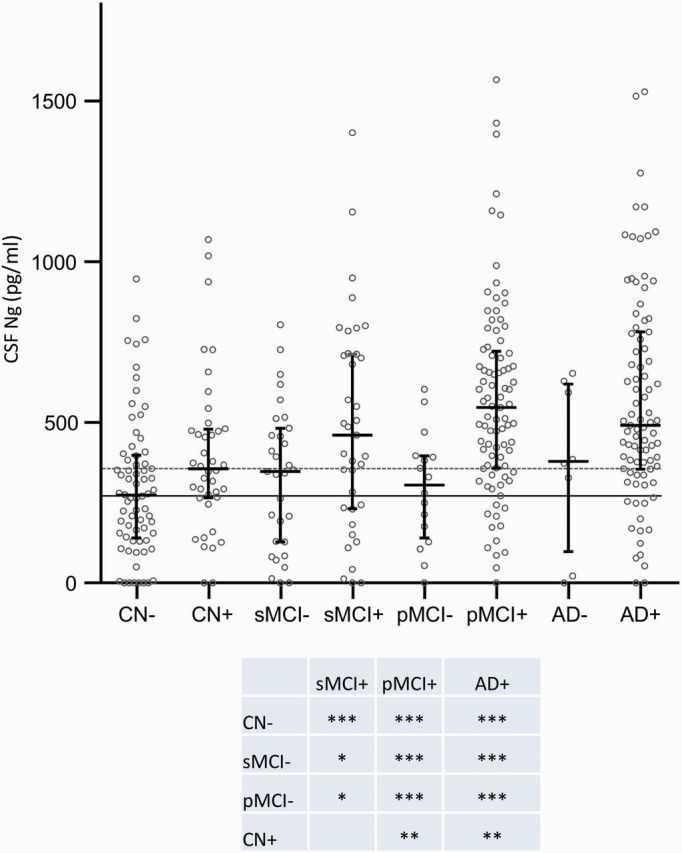
Scatter plot showing the subjects included in the study classified as amyloid positive (+) or negative (−) based on a previously established cut-off (CSF amyloid-β42 < 192 pg/ml). The data are presented as medians and interquartile ranges. Differences between groups were assessed by linear regression, adjusted for age and sex. *P < 0.05; **P < 0.01; ***P < 0.001. Ng = neurogranin.