
Figure 5.
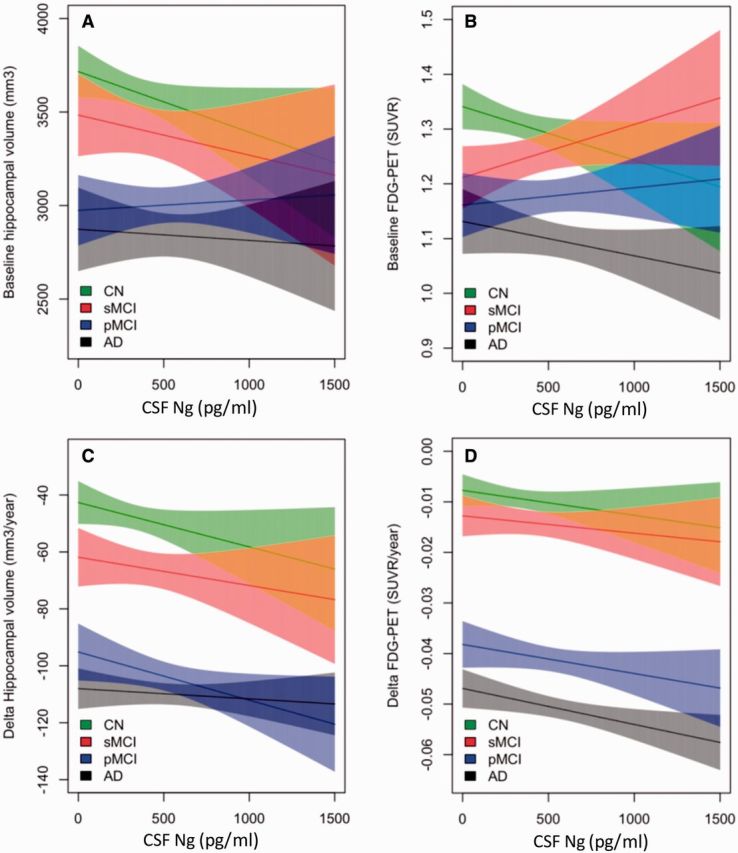
CSF neurogranin in relation to brain structure and cognition. Hippocampal volume and FDG-PET at baseline (A and B) and over time (C and D) as a function of baseline CSF neurogranin in different diagnostic groups. Shaded areas indicate 95% CI of the mean. CN = cognitively normal (green); sMCI = stable MCI (red); pMCI = progressive MCI (blue); AD = Alzheimer’s disease (grey).