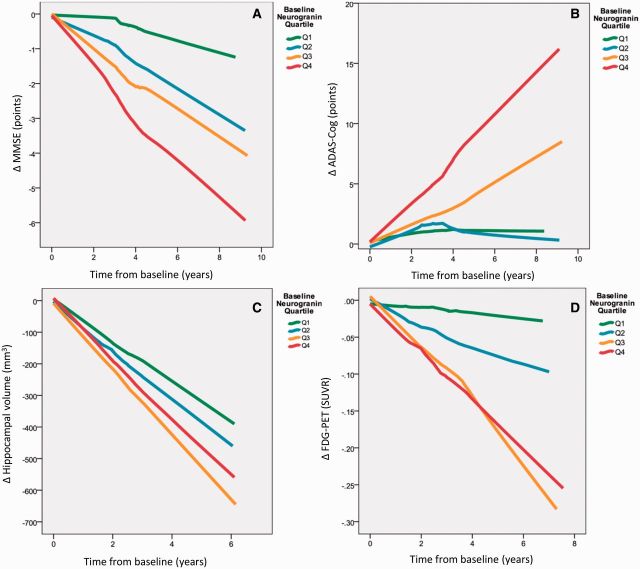
Figure 6.
CSF neurogranin as a predictor of disease progression. The patients were divided into quartiles according to CSF neurogranin levels at baseline. All trend lines were calculated using local regression. (A) Patients with higher levels of CSF neurogranin at baseline have faster disease progression over time as measured by change in MMSE scores. Quartile 1: n = 43, quartile 2: n = 43, quartile 3: n = 42 and quartile 4: n = 45. (B) Patients with higher levels of CSF neurogranin at baseline have faster disease progression over time as measured by change in ADAS-Cog scores. However, Q2 and Q1 overlap. Quartile 1: n = 43, quartile 2: n = 43, quartile 3: n = 42 and quartile 4: n = 45. (C) Generally, patients with higher levels of CSF neurogranin at baseline have faster disease progression over time as measured by hippocampal volume change. However, the patients with the highest levels of CSF neurogranin (Q4) progress slower than Q3. Quartile 1: n = 43, quartile 2: n = 42, quartile 3: n = 42 and quartile 4: n = 43. (D) Patients with higher levels of CSF neurogranin at baseline have faster disease progression over time as measured by change in FDG-PET signals. However, Q3 and Q4 overlap. Quartile 1: n = 19, quartile 2: n = 26, quartile 3: n = 21 and quartile 4: n = 22. SUVR=standardized uptake value ratio.

