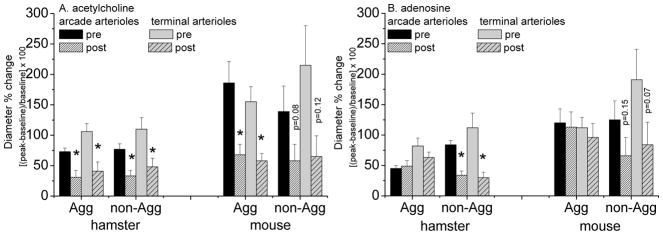
Figure 4.
Diameter changes (mean±SEM) with 30s continuous exposure to micropipette applied acetylcholine (panel A, 10−4 mol/L) or adenosine (panel B, 10−4 mol/L) before (pre) and 15–30 minutes after (post) nanotube exposure to the highest concentration of 50 μg/ml Fe-SWCNT or Gd-SWCNT (the concentration in the micropipette; kindly refer to the Methods for calculation of the exposure dose per arteriole). [Same animals as for Figure 3 so that paired comparisons could be made.] *post differs from pre, p<0.05. Agg = aggregated; non-Agg = non-aggregated. The data for the Gd-SWCNTs and Fe-SWCNTs are pooled together; there was no statistical difference in the data between these formulations (Gd- vs. Fe-SWCNT).

