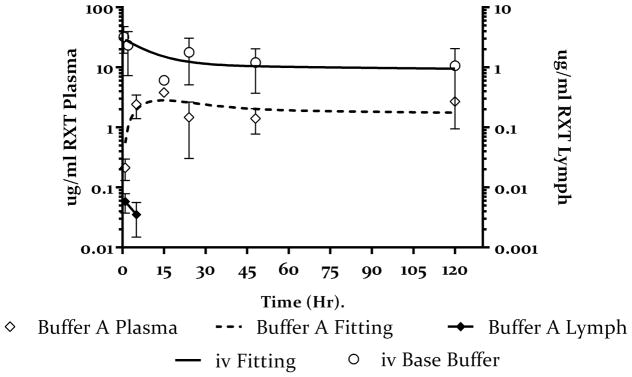
Figure 3.
Plasma (open symbols) and lymph node (closed symbols) concentration-time profile of rituximab after iv (open circles) and sc (open diamonds) administration in SW mice. 1ug/g rituximab was injected sc or iv and the plasma concentrations were monitored for 120 hours. The sold line represents the fitting of the iv data to a 2 compartment model and the dashed line represent the fitting of the sc data to the PK model in figure 2. The closed diamonds represents inguinal lymph node concentration of rituximab after sc administration. Values presented as mean ± SD.

