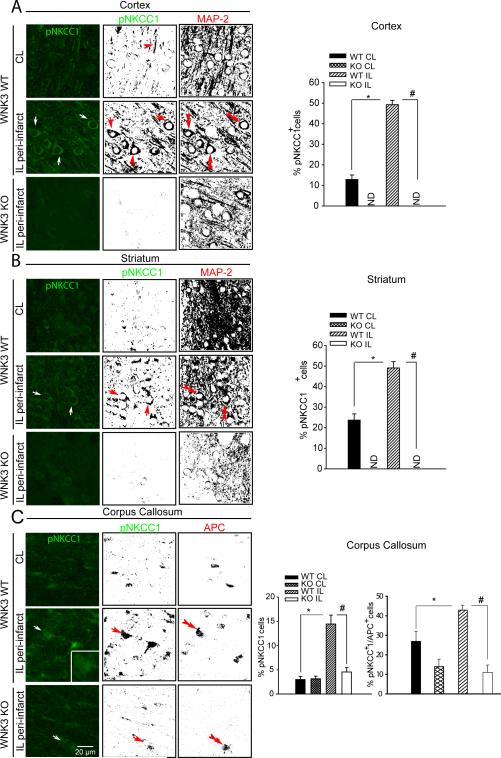
Figure 4. WNK3-dependent phospho-activation of the NKCC1 cotransporter in ischemic neurons and oligodendrocytes in vivo.
A and B. Representative immunofluorescence images and binary images of pNKCC1 (green) and MAP-2 (red) staining in WT or WNK3 KO mouse cortex (A) or striatum (B) after 24 h Rp following MCAO. Arrow: neurons or oligodendrocytes with increased functional expression of pNKCC1.Double arrowhead: MAP2+ neurons. Scale bar: 20 μm. C. Representative images of pNKCC1 (green) or APC (red) staining in the corpus callosum after 3 d Rp following MCAO. Right panels, Summary pNKCC1 expression data in total cells (TO-PRO-3-positive cells). Values represent mean ± S.E.M (n = 3). * p <0.05 vs. CL. Summary of pNKCC1 expression data in mature oligodendrocytes (APC-positive cells). Values represent mean ± S.E.M. (n = 4). *P < 0.05. # P < 0.05.

