Fig. 4.

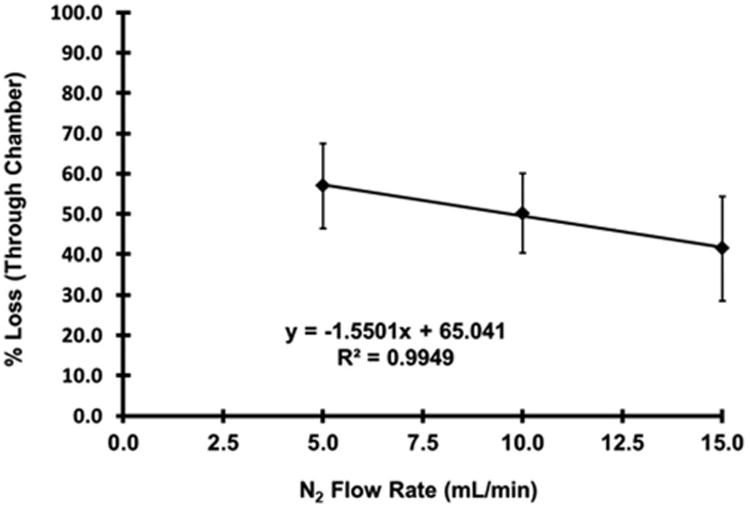
Percent loss of NO3• between the CRDS cavity and the experiment chamber based on N2 flow through the N2O5 trap. Error bars represent the standard deviations from five separate experiments at each flow rate.

Percent loss of NO3• between the CRDS cavity and the experiment chamber based on N2 flow through the N2O5 trap. Error bars represent the standard deviations from five separate experiments at each flow rate.