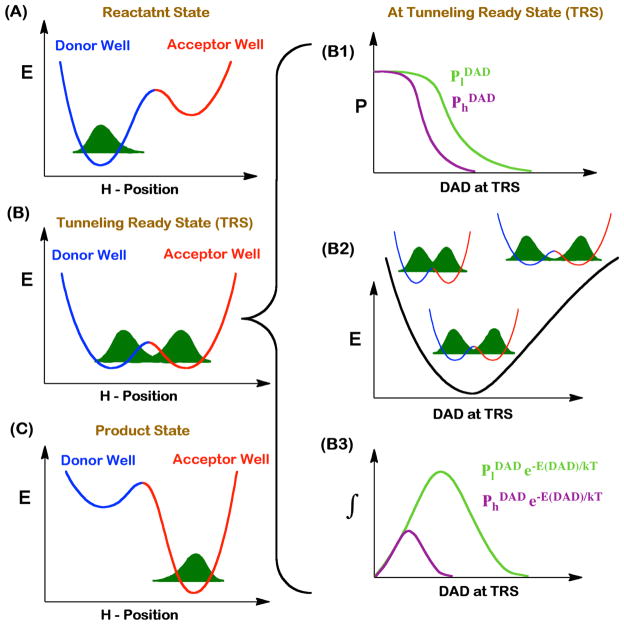
Figure 1.
Phenomenological models for activated H-tunneling. Left column represents three stages of the reaction along the H-transfer coordinate. Motion of the protein, solvent, and reactants modulate the potential energy surfaces for the H-transfer. At the reactant state (A), the H-wavefunction is localized in the donor well. The motion of the heavy atoms transiently brings the donor and the acceptor wells into the tunneling ready state (TRS, B), where isotopically sensitive H-transfer from donor to acceptor occurs. Further rearrangement in the heavy atoms interrupts the TRS, resulting in entrapment of the hydrogen in the product well (C). The right column demonstrates the contributing factors that modulate H-transfer probability at the TRS. The panel B1 shows the transmission probabilities of light (l, green) and heavy (h, purple) hydrogen isotopes as a function of DAD. Panel B2 represents a potential energy surface (PES) for the DAD fluctuations. Panel B3 shows the product of DADs and transmission probabilities.

