Figure 3.
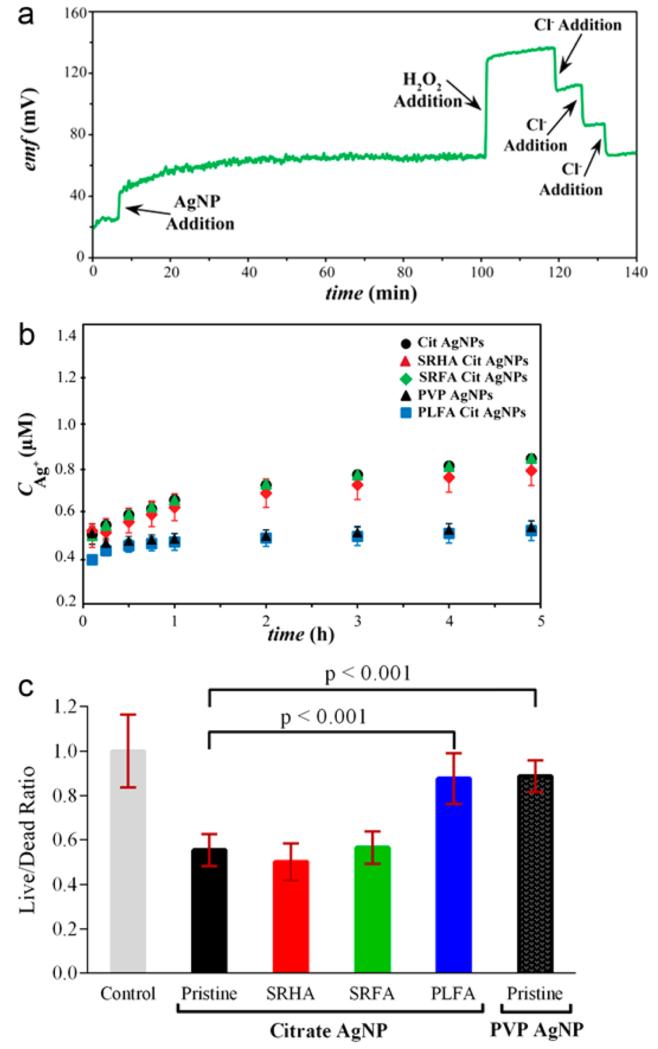
(a) Continuous detection with fluorous-phase Ag+ ISEs: 5 mg Ag/L citrate-capped AgNPs were added to pH = 7.5 buffer while monitoring the Ag+ release. H2O2 was added to oxidize AgNPs, and Cl− was added to reduce the Ag+ concentration. (b) Dissolution of citrate-capped and PVP-capped AgNPs in pH 7.5 buffer (5 mg Ag/L) with or without prior incubation with NOM (nonsurface bound NOM concentration 10 mg/L). Error bars represent standard deviations of three replicate measurements. (c) Effect of AgNPs on Shewanella membrane integrity as a function of NOM type, as evaluated using fluorescent dyes; shown is the ratio of fluorescence emission intensities for a membrane permeable dye (indicating live cells) and a membrane impermeable dye (indicating dead cells). Data collected from cells exposed to pristine nanoparticles (NP) and cells exposed to nanoparticles previously incubated with 600 mg/L NOM (PLFA-NP, SRFA-NP, and SRHA-NP) at the specified concentration were normalized to a negative control from Shewanella not exposed to nanoparticles; values smaller than 1 indicate decreased membrane integrity following nanoparticle exposure. Error bars represent standard deviations of three biological replicates.

