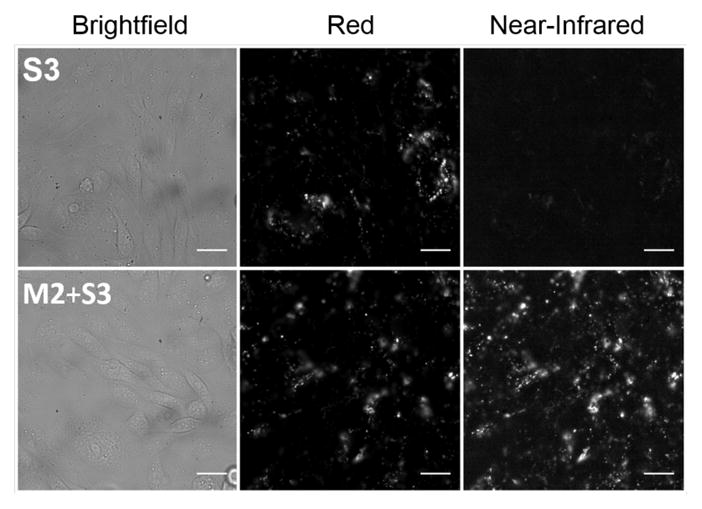
Figure 3.

Micrographs of live CHO cells in culture media at 8 hours after treatment with: (top row) S3 (10 μM); (bottom row) mixture of M2+S3 (10 μM each). Epifluorescence images acquired using Red (ex: 620±60 nm, em: 700±75 nm) or Near-Infrared (ex: 710±75 nm, em: 810±90 nm) filter sets. Scale bar = 10 μm.
