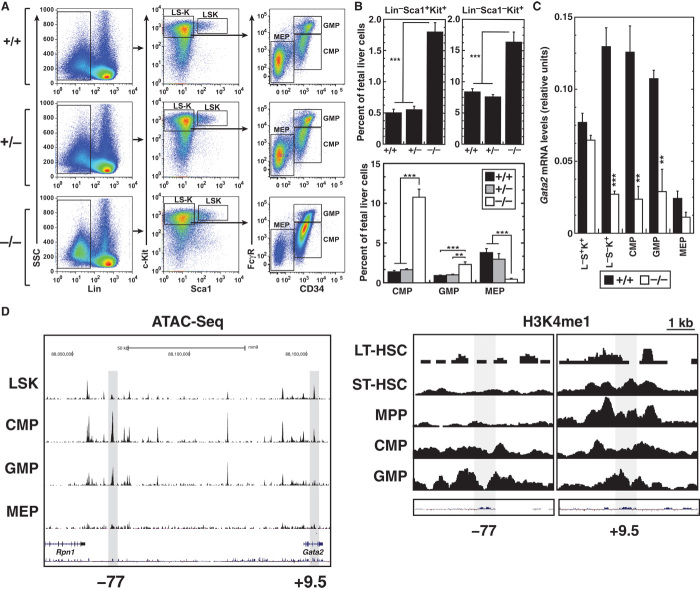
Fig. 3. Selective loss of Gata2 expression in −77−/− myeloid progenitors disrupts homeostasis.
(A) Representative flow cytometric analysis of E13.5 fetal livers for Lin−Sca1+Kit+ and Lin−Sca1−Kit+ cells, CMPs (Lin−CD34+FcγRlowKit+Sca1−), GMPs (Lin−CD34+FcγRhighKit+Sca1−), and MEPs (Lin−CD34−FcγRlowKit+Sca1−). (B) Percentages of Lin−Sca1+Kit+ and Lin−Sca1−Kit+ cells [top; −77+/+ (n = 7), −77+/− (n = 17), and −77−/− (n = 6)] and CMPs, GMPs, and MEPs [bottom; −77+/+ (n = 8), −77+/− (n = 6), and −77−/− (n = 9)]. (C) Quantitation of Gata2 mRNA levels in Lin−Sca1+Kit+ and Lin−Sca1−Kit+ cells [−77+/+ (n = 5) and −77−/− (n = 7)] and CMPs, GMPs, and MEPs [−77+/+ (n = 4) and −77−/− (n = 4)]. (D) Profiles for chromatin accessibility via the assay for transposase-accessible chromatin (ATAC) and histone H3K4 monomethylation mined from existing data (53). Graphs show means ± SEM; **P < 0.01, ***P < 0.001.

