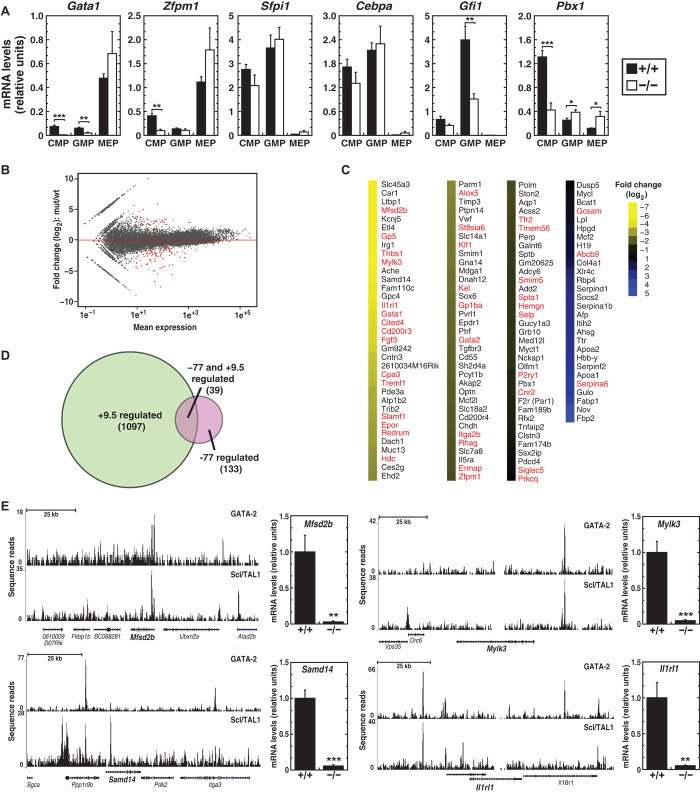
Fig. 5. −77 establishes a functionally vital sector of the myeloid progenitor cell transcriptome.
(A) Quantitative gene expression analysis in CMPs, GMPs, and MEPs from −77+/+ and 77−/− E13.5 fetal livers [−77+/+ (n = 4) and −77−/− (n = 4)]. (B) MA plot of RNA-seq–based comparison of CMP transcriptomes from −77+/+ and −77−/− E13.5 fetal livers [−77+/+ (n = 3) and −77−/− (n = 3)]. Red points indicate down- or up-regulated genes [false discovery rate (FDR) <0.05]. (C) Heatmap depicting statistically significant genes down- or up-regulated by >1.5-fold. (D) Venn diagram depicting the extent of overlap between genes regulated by +9.5 in AGM (13) and −77 in CMPs. Genes shared between data sets are indicated in red in (C). (E) Evidence for direct GATA-2 regulation of −77 target genes. ChIP-seq profiles of GATA-2 and Scl/TAL1 in HPC-7 cells (58) and quantitative gene expression analysis in CMPs from −77+/+ and −77−/− E13.5 fetal livers [−77+/+ (n = 4) and −77−/− (n = 4)]. Graphs show means ± SEM; *P < 0.05, **P < 0.01, ***P < 0.001.

