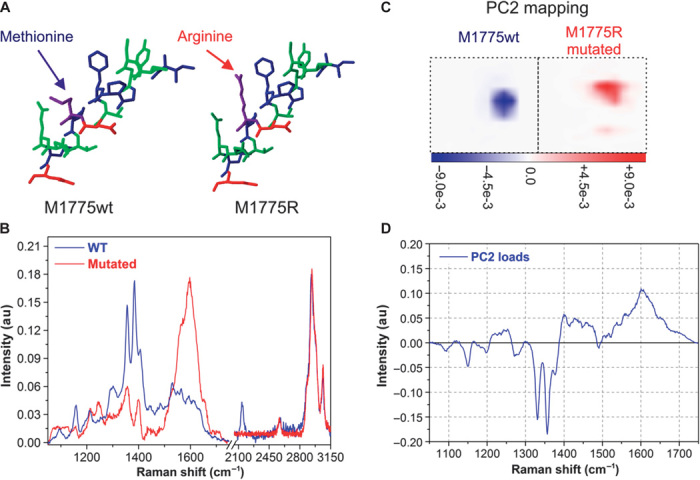
Fig. 6. Raman spectra of pure wild-type and mutated peptides.

(A and B) Raman spectra (B) show a net difference between two peptides differentiated by only the exchange of one amino acid (A; a methionine with an arginine). These spectra constitute the base set for the fitting procedure. Their net difference allows identification of mutated peptides in the mixture. (C and D) The results of PCA are also shown: a 2D map of the PC2 coefficients of two pixels (C), one pixel for each peptide, where color code is proportional to the significance of the PC2 parameter over the map; the PC2 parameter load curve (D) takes into account spectral differences between the two peptides. The combination of PC2 mapping and PC2 load curve allows identification of pixels dominated by wild-type or mutated species.
