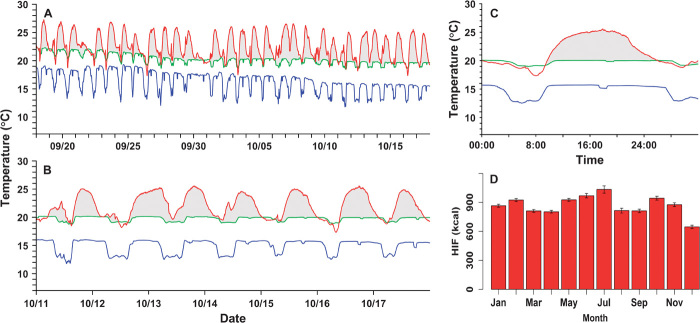
Fig. 1. Extracts of raw data collected by an archival tag implanted into the peritoneal cavity of a wild juvenile Pacific bluefin tuna in 2003.
(A to C) One month of data (A); 1 week of data (B); one HIF event (over 16 to 17 October) (C). In (A) to (C), the red line shows visceral temperature, the blue line shows ambient temperature, and the green line shows the predicted resting visceral temperature [obtained using a statistical model (22)]. (D) Monthly mean HIF from the raw data for archival tagged Pacific bluefin tuna in the California Current between 2002 and 2009. Vertical bars extend to 1.96 SE below and above the mean.

