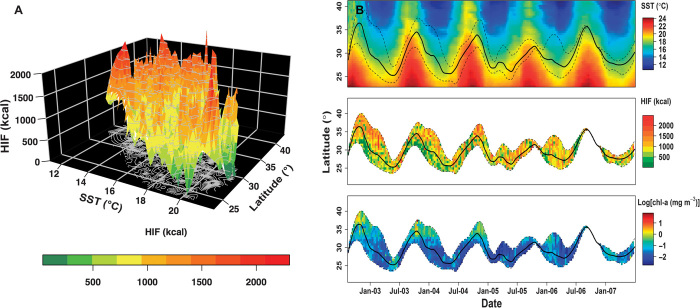
Fig. 3. HIF in relation to SST, latitude, and chl-a.
(A) Three-dimensional contour plot for observed daily energy intake in 2003 (interpolated and smoothed for visualization) against mean daily SST and latitude. (B) Latitudinal distribution of 144 tagged bluefin tuna in the California Current, 2002 to 2007. (Top) Date versus latitude with remotely sensed mean daily SST (°C) indicated by the color scale. (Center) Date versus latitude with median daily energy intake (kcal) indicated by the color scale. (Bottom) Date versus latitude with the logarithm of median daily chlorophyll-a concentration (mg m−3) indicated by the color scale. The solid black line in each panel denotes the median latitude of archival tagged tuna, whereas the dashed lines show the 2.5th and 97.5th percentiles for the latitudinal distribution.

