
Fig. 5. Correlates of average daily energy intake (kcal) in tagged Pacific bluefin tuna.
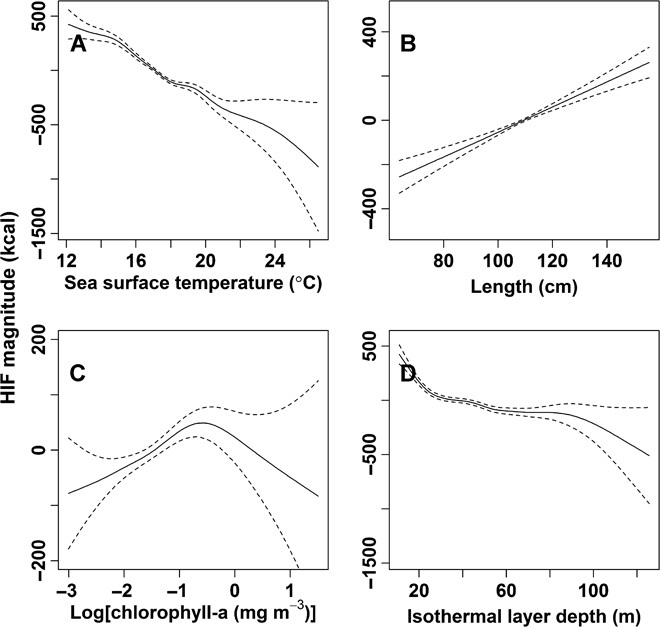
Estimated response curves (smooth terms) and year effects from the final GAMM. (A to D) SST (A), length of the tagged tuna (B), chlorophyll-a concentration (C), and isothermal layer depth (D). Dashed lines represent 95% confidence limits. Vertical axes are partial responses (estimated, centered smooth functions) on the scale of the linear predictor.