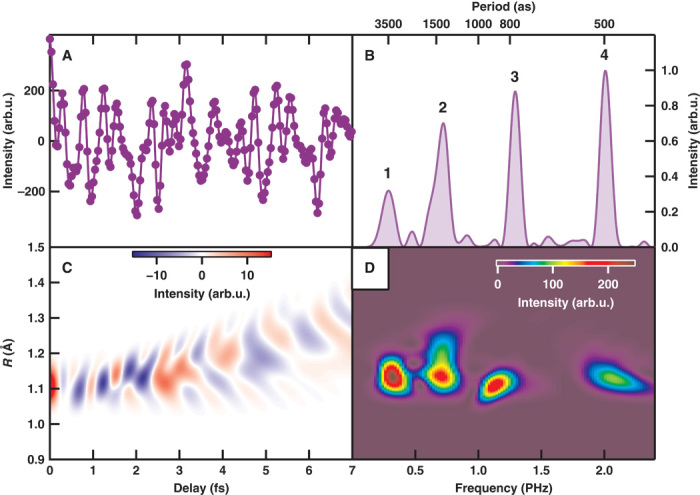
Fig. 2. Attosecond electron responses in the pump-probe measurement.

(A) Temporal evolution of fragment ion intensity at E = 0.2 eV. (B) Fourier power spectrum of (A). (C) Numerical simulation of the nuclear correlation function composed of four pairs of electronic states. (D) Fourier power spectrogram of (C).
