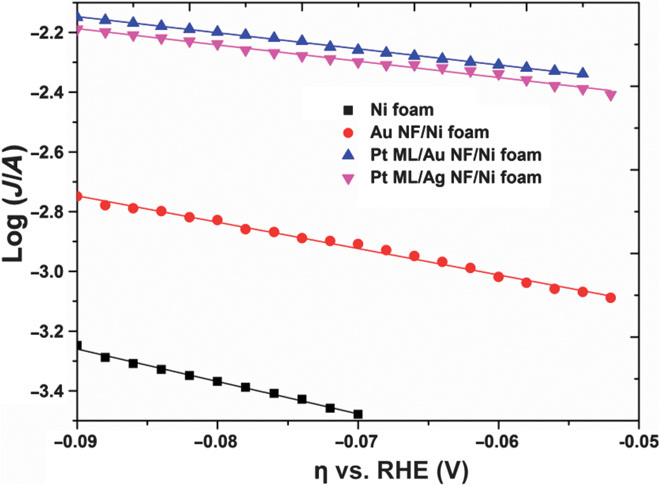
Fig. 6. Tafel plots of the Pt monolayer on different metal NFs recorded at 50 mV s−1 in 0.5 M H2SO4 after iR correction.

A comparison before and after the iR correction is shown in fig. S3.

A comparison before and after the iR correction is shown in fig. S3.