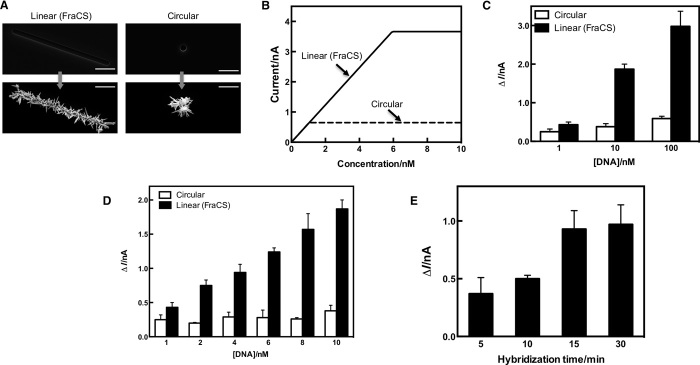
Fig. 2. Rapid quantitation of LTx analytes using FraCS.
(A) Images collected with scanning electron microscopy for FraCS templated with linear apertures compared to those made with smaller round apertures. The scale bar shown on each image corresponds to 20 μm. (B) Mathematical modeling of FraCS (solid line) versus sensors made with circular templates (dashed line) for the current generated by the sensor as a function of DNA concentration. (C and D) Quantitative comparisons of sensors with circular apertures (white bars) and FraCS (black bars) between 1- to 100-nM target (C) and 1- to 10-nM target (D). (E) Hybridization time course for rapid RNA analysis using FraCS. Data represent n = 15 different sensors. Columns represent mean, and error bars correspond to SEM.

